10 Key Performance Indicators (KPIs) Examples for Business Success
Introduction
Are you overwhelmed by the challenge of identifying the right metrics for your organization? Many organizations waste time and resources on metrics that don’t align with their goals. Let’s explore ten essential KPIs that can truly transform how you measure performance and drive growth. By exploring tailored approaches to KPI development, you’ll uncover actionable insights that can lead to improved decision-making and strategic alignment. Failing to customize your metrics could mean missing out on significant growth opportunities.
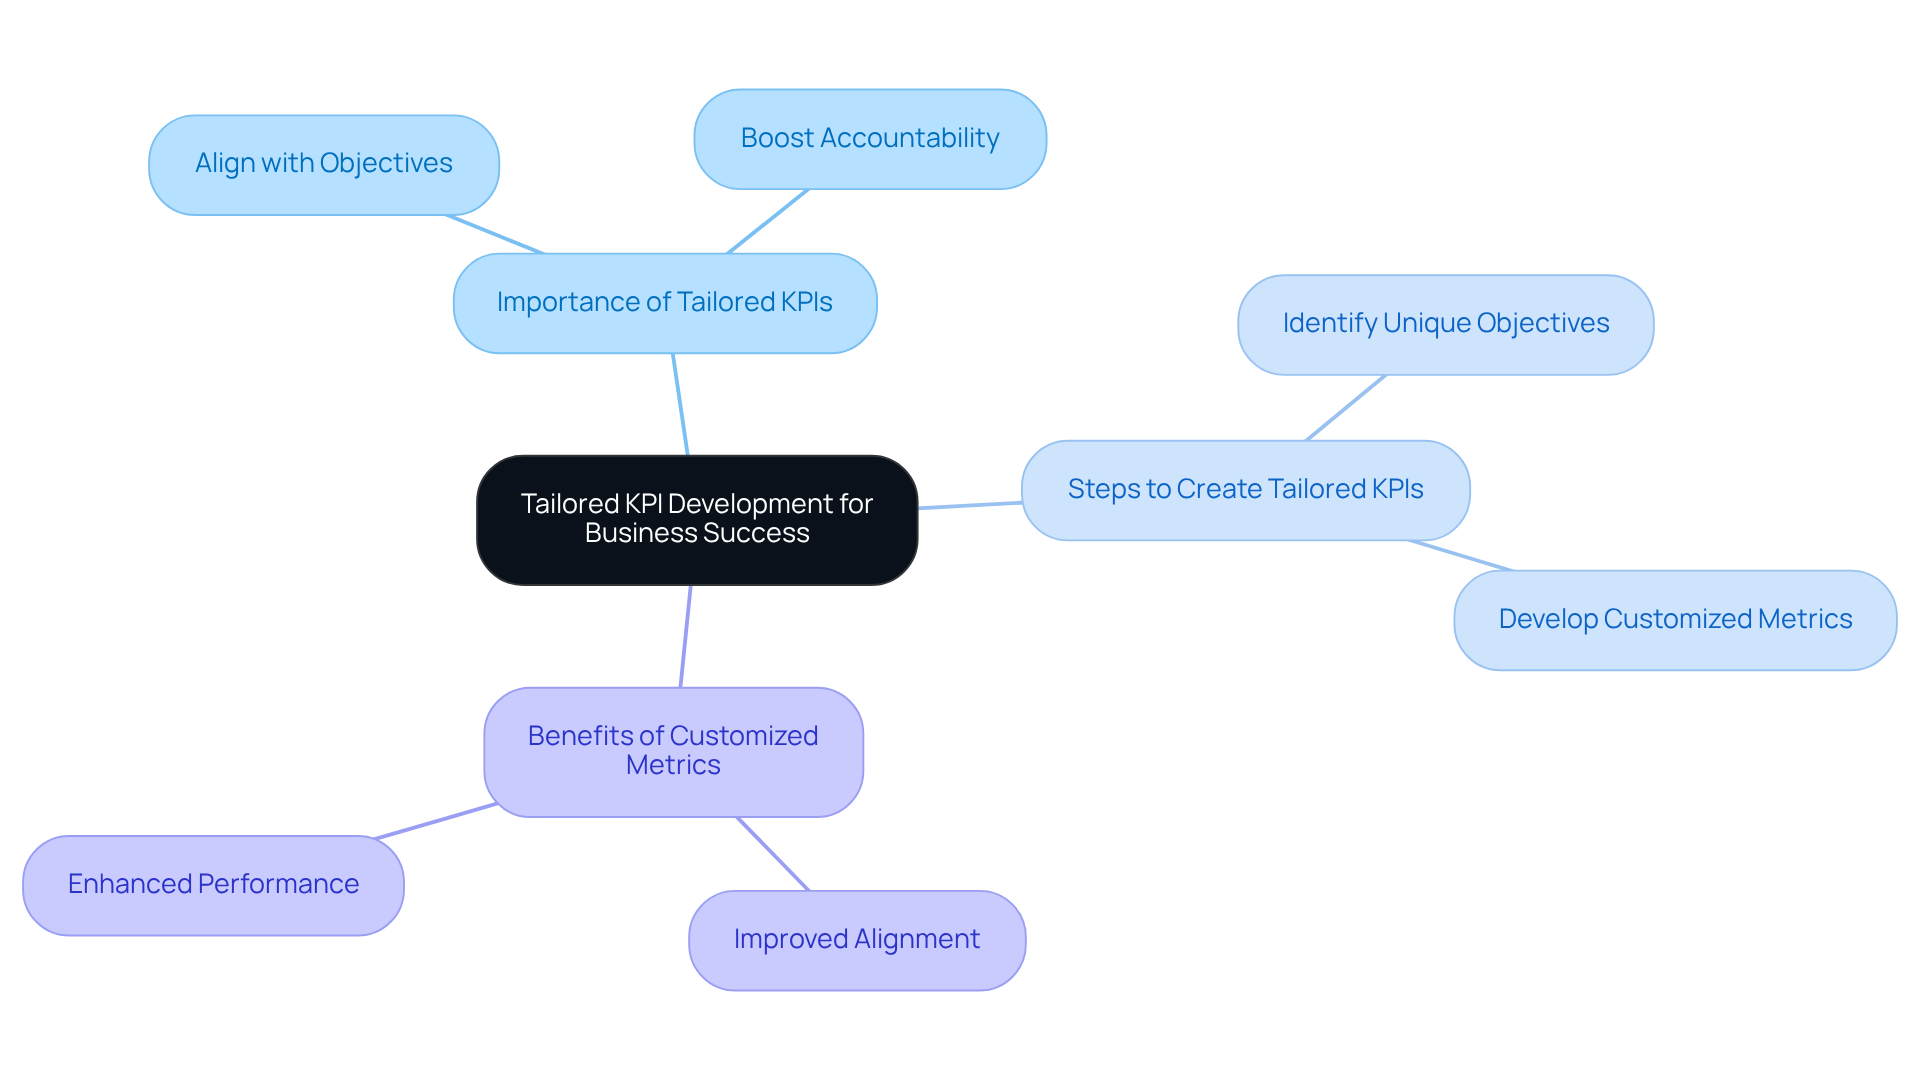
MAP Consulting: Tailored KPI Development for Business Success
Are you struggling to measure your organization’s success effectively? You need customized key performance indicators (KPIs) examples that are tailored to align with your organization’s unique objectives and challenges. That’s where MAP Consulting comes in.
The Disciplined Leader understands the importance of tailored key performance indicators (KPIs) examples. Without them, you may find it challenging to measure success accurately, which can lead to misaligned strategies and wasted resources. This tailored approach helps you pinpoint critical success factors and boosts team accountability, driving sustainable growth by utilizing key performance indicators (KPIs) examples.
Organizations that implement customized metrics often experience improved alignment with their strategic goals. For instance, companies that emphasize customer retention and satisfaction as key performance indicators (KPIs) examples frequently see increased loyalty and repeat transactions, essential for long-term success. In today’s competitive landscape, the integration of key performance indicators (KPIs) examples is crucial, as accurate information is vital for informed decision-making.
Case in point: MAP Consulting’s collaboration with AbilityFirst led to a significant increase in summer camp enrollment, demonstrating how tailored KPIs can drive operational efficiency and growth. If you regularly monitor your KPIs, you can make proactive adjustments, ensuring alignment with evolving market conditions and internal objectives.
Expert insights emphasize that selecting the right KPIs is crucial for effectiveness, as each company has distinct goals. If you align key performance indicators (KPIs) examples closely with these objectives, your business can achieve better strategic outcomes and enhance overall performance. This commitment to customized key performance indicators (KPIs) examples positions MAP Consulting as a leader in driving organizational success through tailored performance measurement.
Take Action!
- Identify your organization’s unique objectives.
- Create tailored KPIs that align with these goals.
- Stop relying on generic metrics that fail to drive results.
Customer Acquisition Cost (CAC): Measuring Marketing Efficiency
Are you struggling to keep client acquisition costs in check while trying to grow your business? Understanding Client Acquisition Cost (CAC) is crucial; it’s calculated by dividing your total sales and marketing expenses by the number of new clients gained in a given period. You need to grasp this key performance indicators (KPIs) examples to understand how much your company spends on acquiring each new customer.
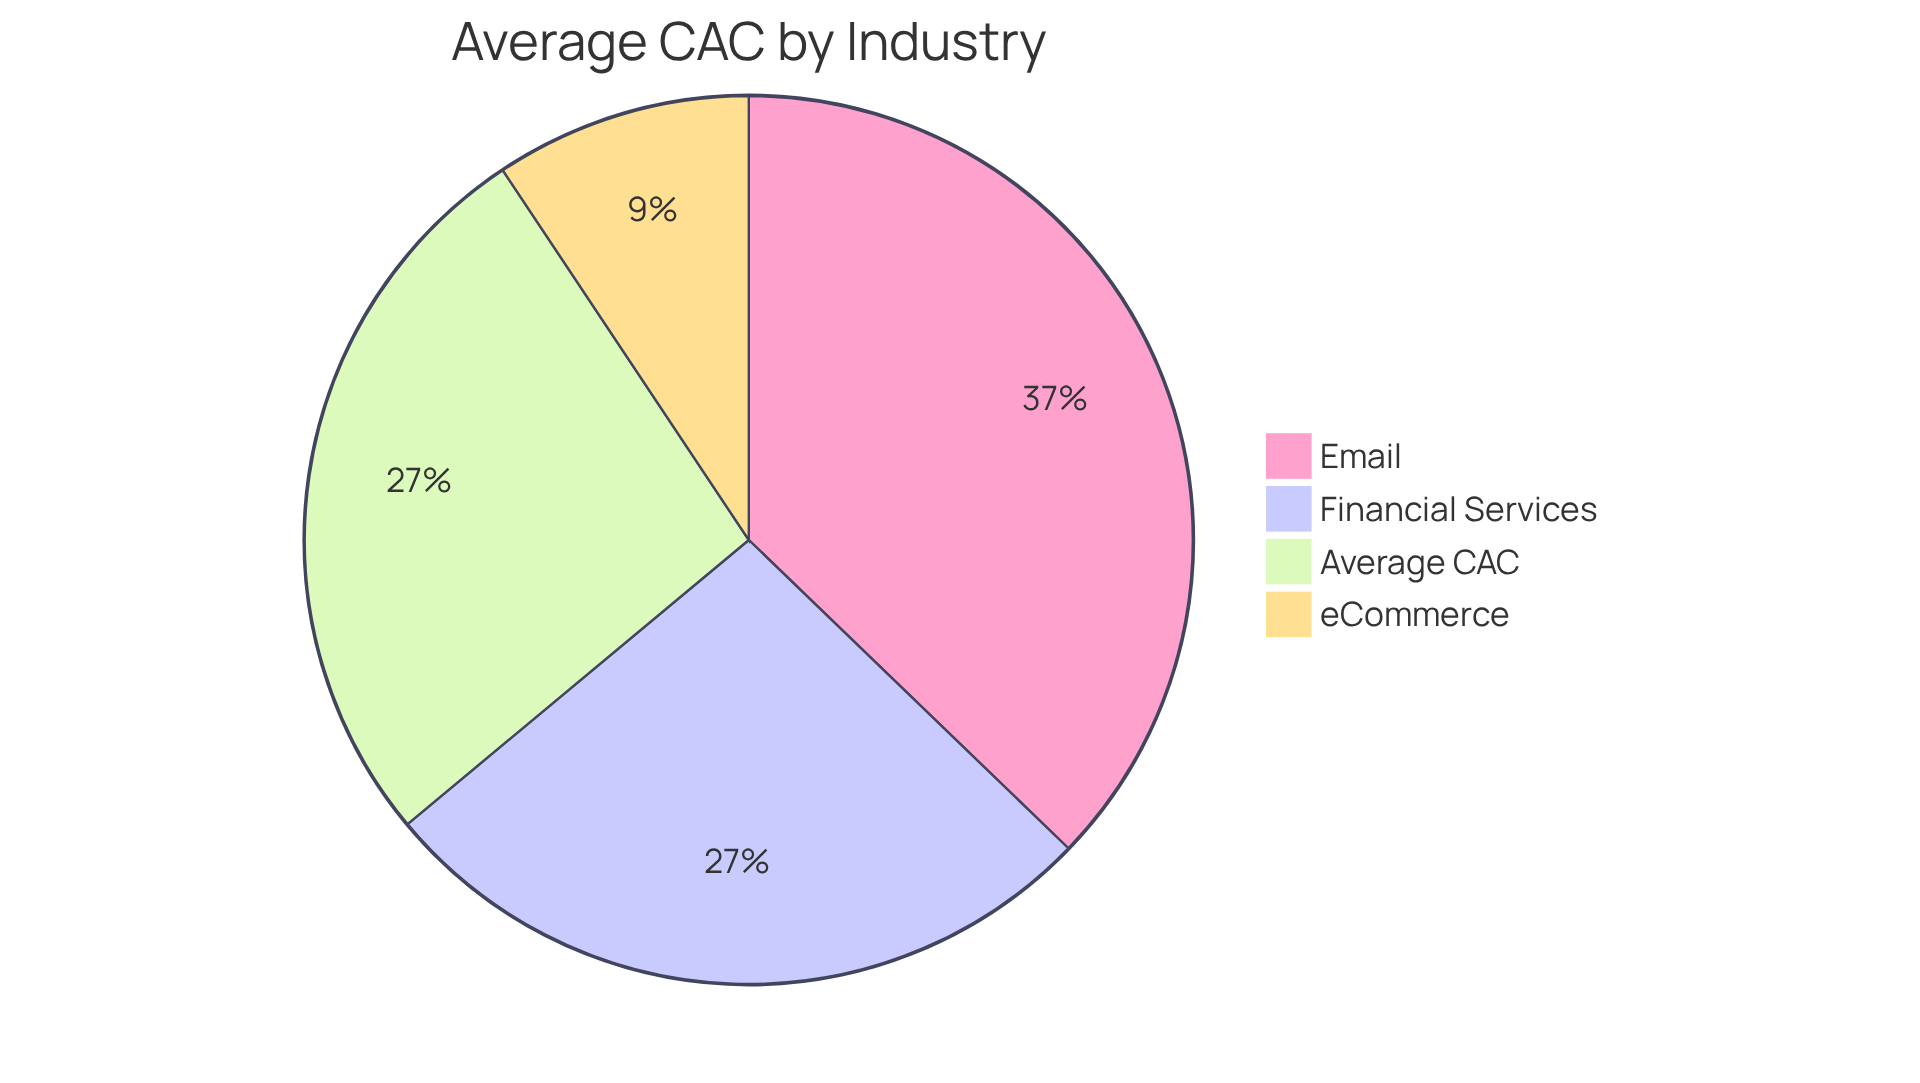
In 2026, are you aware of how CAC varies across industries? For instance, Financial Services average $784 while eCommerce sits at $274. This disparity underscores the importance of industry-specific strategies in managing acquisition costs. Additionally, the average CAC for Email is projected to be $1,091.20, reflecting a 6% increase from 2024.
As you strategize, aim for a healthy LTV:CAC ratio of around 3:1 to ensure you can cover acquisition costs while still investing in growth. Industry leaders highlight that enhancing retention rates can significantly improve CAC efficiency, with current clients generating 65% of a company’s revenue and repeat clients contributing 65% of sales. A mere 5% increase in retention may enhance earnings by 25-95%.
Let’s look at key performance indicators (KPIs) examples that show how successful companies have tackled CAC reduction through innovative strategies. For example, predictive lead scoring has been shown to decrease sales development representative (SDR) cycles on poor-fit leads by 30-40%, resulting in a 15-18% reduction in CAC. Additionally, brands leveraging AI for outbound communications report a 31% increase in meetings booked per SDR-week, demonstrating how technology can streamline acquisition processes and lower costs.
Navigating the evolving landscape of client acquisition is essential for your sustainable growth and competitive edge.
Net Promoter Score (NPS): Assessing Customer Loyalty and Satisfaction
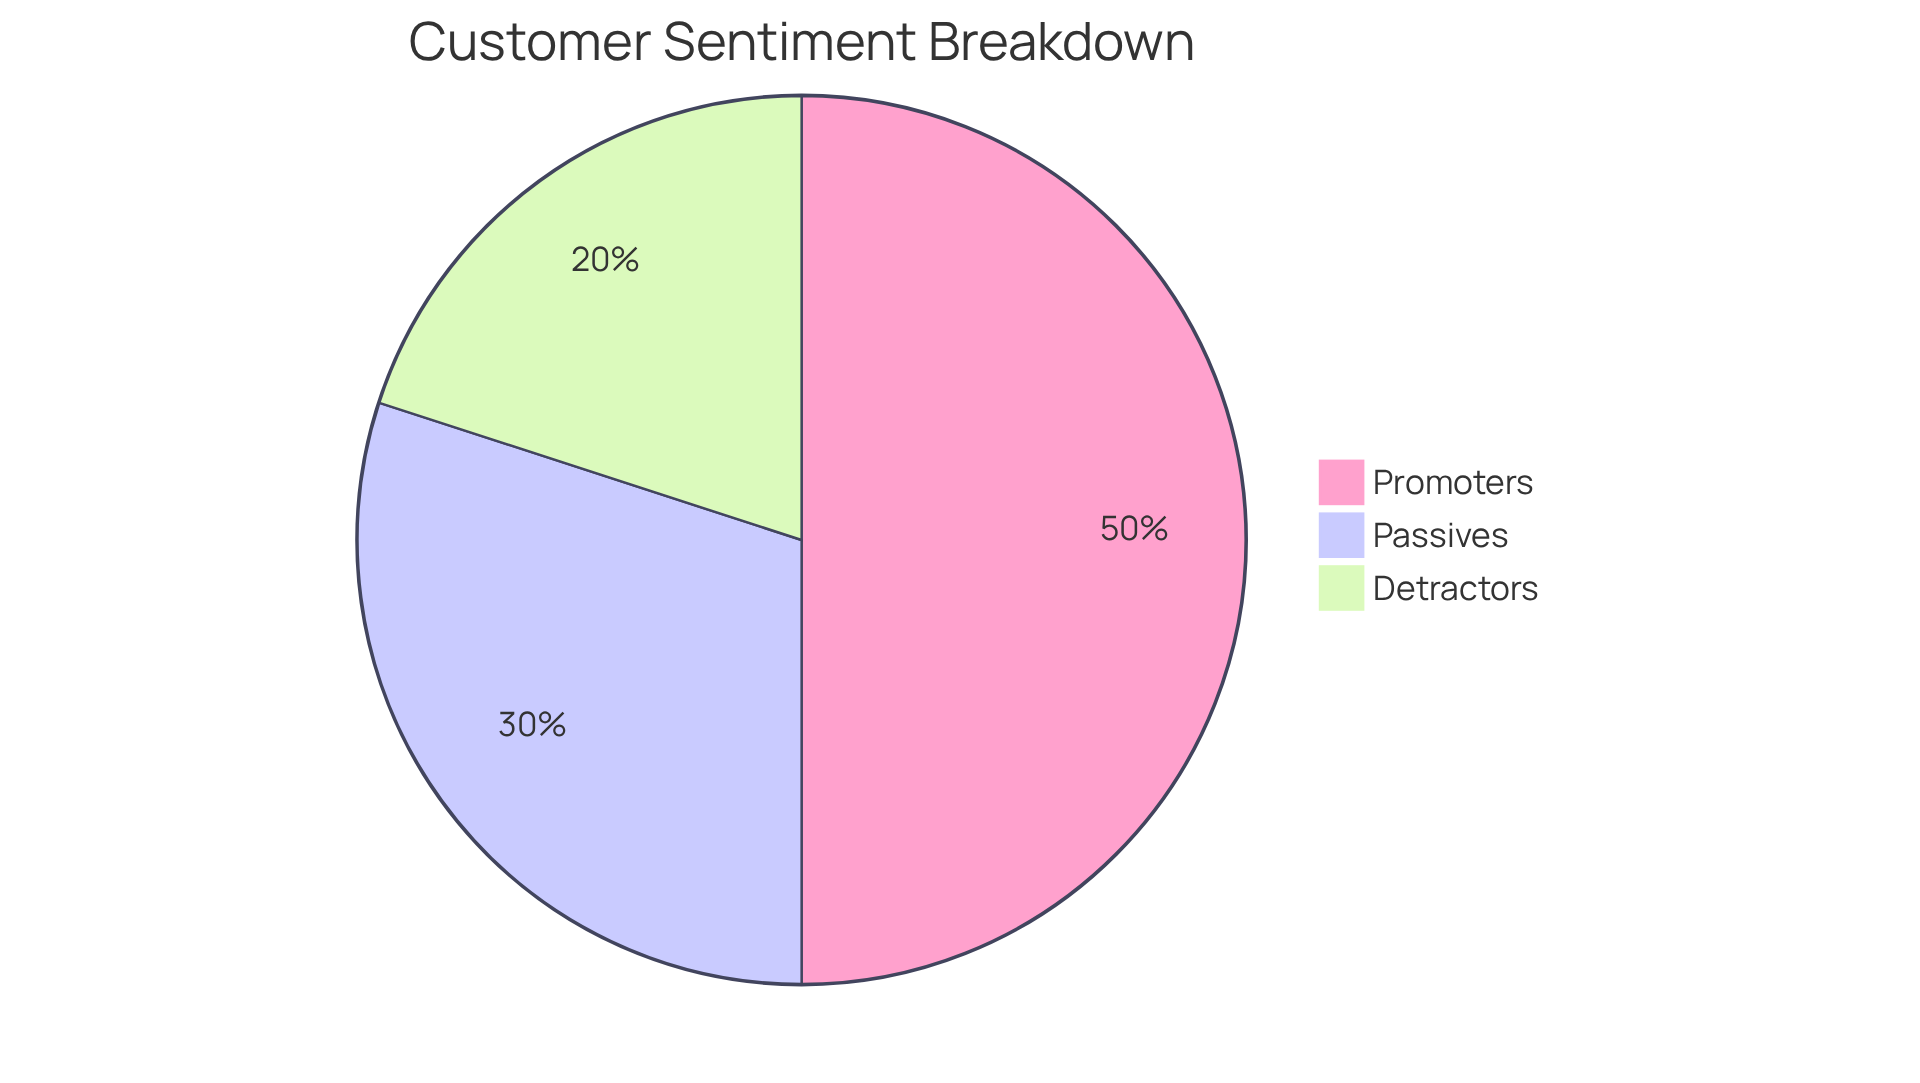
Are you truly aware of how your clients perceive your brand? The Net Promoter Score (NPS) can help you find out by asking them how likely they are to recommend your products or services. A high NPS shows that your clients are loyal advocates, while a low score can be a red flag for underlying issues that need your attention.
Make it a priority to regularly evaluate your NPS; it’s a vital tool for gaining insights into client satisfaction and making informed decisions that enhance your offerings.
Monthly Recurring Revenue (MRR): Ensuring Financial Stability
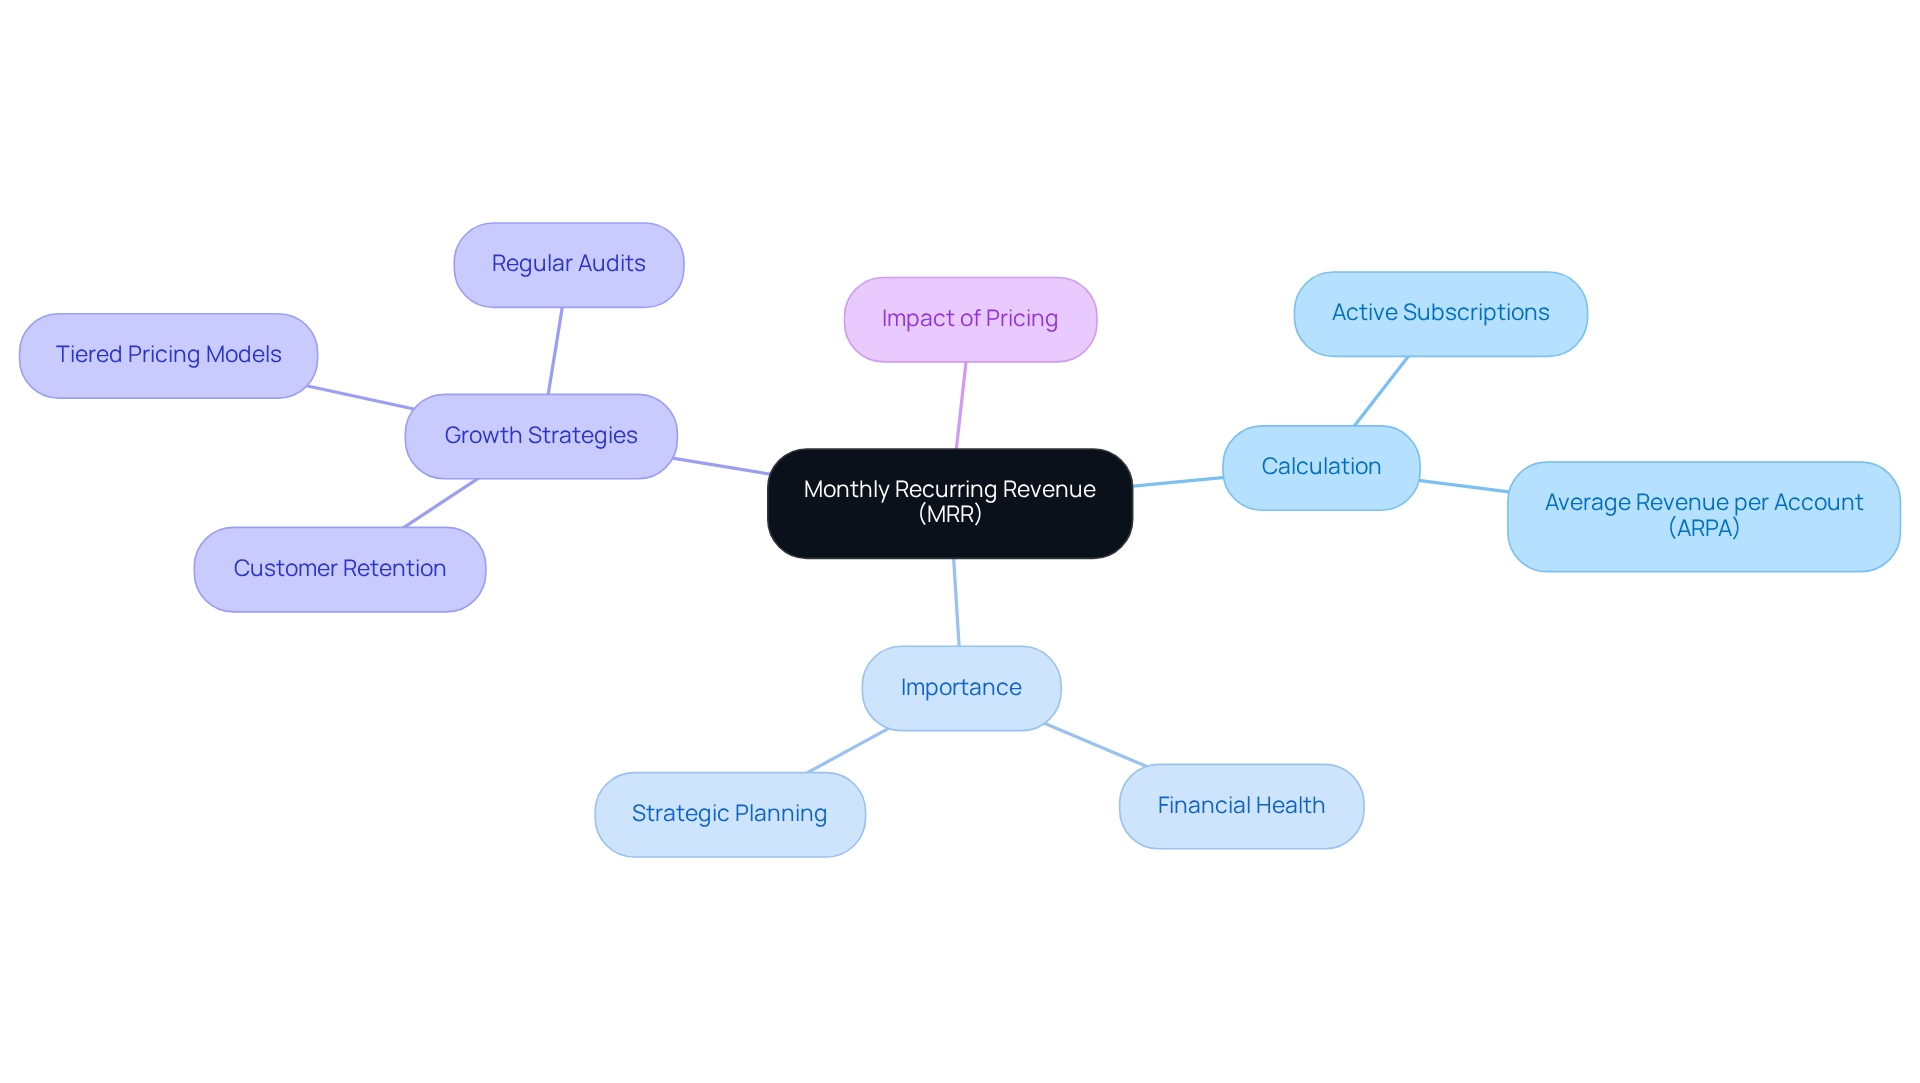
Are you struggling to gauge your company’s financial health? MRR might be the missing piece of the puzzle. Monthly Recurring Revenue (MRR) is a vital metric that reflects the predictable income generated from customers each month, excluding one-time fees. You calculate it by multiplying the total number of active subscriptions by the average revenue per account (ARPA). For subscription-oriented companies, MRR provides a clear perspective on financial well-being, enabling you to strategize for future expansion and make informed choices regarding scaling operations.
In fact, many subscription companies are seeing a 7% increase in MRR, even in tough economic times. How can you achieve similar results? This steady increase highlights the advantages of retaining subscribers and attracting new ones, especially for those using platforms that simplify subscription management. Companies with a Net MRR growth rate of 10-20% are regarded as performing well, suggesting a healthy trajectory.
To calculate MRR accurately, focus solely on recurring revenue. Avoid one-time payments or discounts that can skew your financial picture. Regular audits of MRR can help you identify discrepancies and ensure accurate financial reporting, which is vital for strategic planning.
Consider this: businesses that leverage MRR effectively often see significant growth. Are you ready to join them? For example, companies that adopted tiered pricing models experienced a 20-30% rise in average revenue per user (ARPU), demonstrating how pricing approaches can greatly influence MRR. Furthermore, those emphasizing customer retention tactics, like providing flexible billing choices and tailored assistance, have reported reduced churn rates and increased MRR.
Expert opinions highlight that MRR is not merely a financial metric but a crucial indicator of your company’s capacity to maintain progress and stability. By understanding and optimizing MRR, you can enhance your financial planning, attract investors, and ultimately drive long-term success. Moreover, aligning MRR approaches with effective talent management practices can create a robust framework for sustainable growth. For instance, ensuring that the right talent is in place to manage client relationships can directly influence MRR outcomes.
To maximize MRR, regularly assess your pricing strategies, focus on customer retention, and ensure precise tracking of your recurring revenue while investing in talent development to support these financial goals.
Employee Engagement Score: Measuring Workforce Morale and Productivity
What if I told you that the Employee Engagement Score is a critical metric that reveals how your team truly feels about their work environment? A high engagement score means your team is motivated, but what does a low score really say? In the U.S., employee engagement stands at just 32%, marking a significant decline from previous years. This decline signals a critical moment for leaders to act before the costs escalate.
You must regularly measure employee engagement to implement strategies that truly enhance morale and reduce turnover. Organizations that continuously assess engagement levels and act on the results tend to see better outcomes compared to those relying solely on annual surveys. By taking a proactive approach, you can swiftly tackle issues and foster a more engaged workforce.
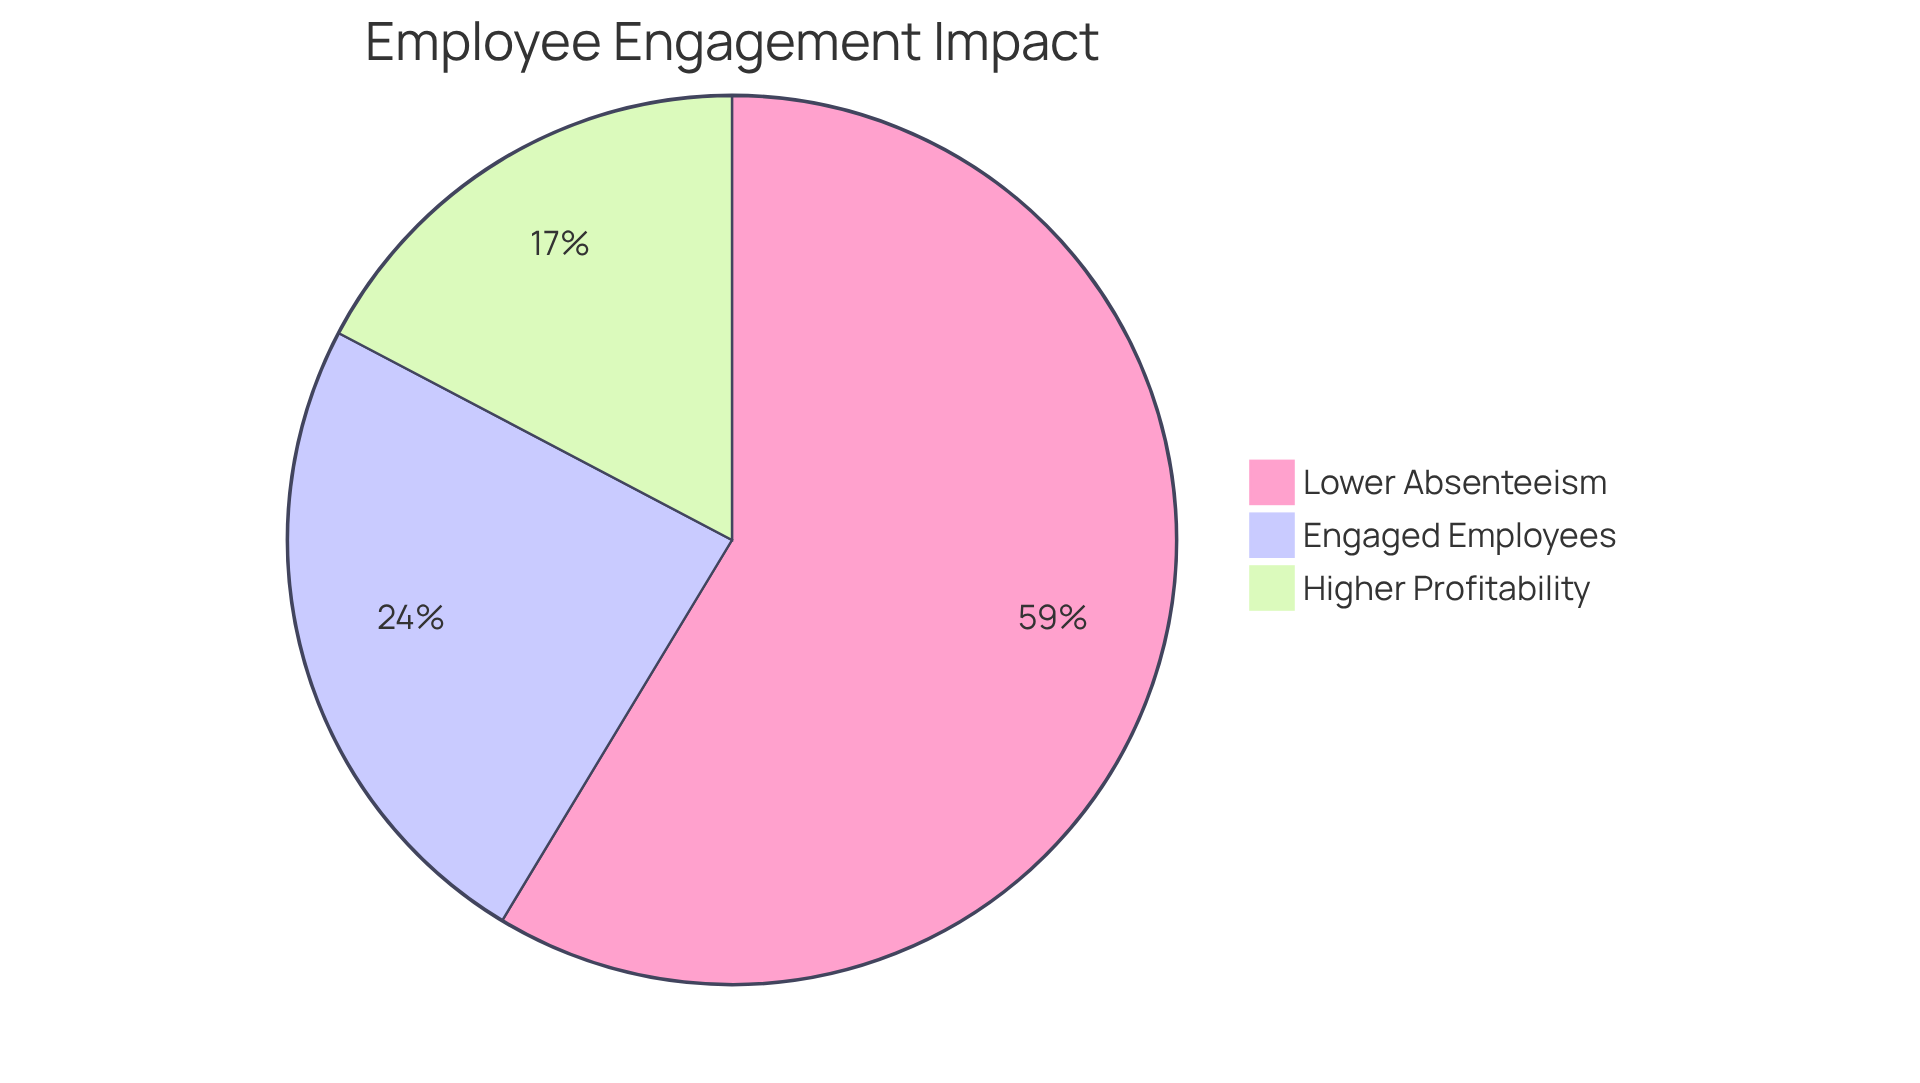
Case studies reveal that organizations with high engagement scores experience substantial benefits, including:
- 23% higher profitability
- 78% lower absenteeism compared to their less engaged counterparts.
For instance, clients like Goettl and Clark Construction have successfully implemented MAP Consulting’s training programs, resulting in improved employee engagement and performance. Furthermore, engaged teams report 32% fewer quality defects, underscoring the direct correlation between employee engagement and overall business performance.
As of 2026, the trend indicates a pressing need for organizations to focus on improving their Employee Engagement Scores, especially given the economic impact of disengagement, which costs the global economy approximately $10 trillion annually. Ignoring engagement could cost your organization dearly, both in morale and in the bottom line.
Conversion Rate: Evaluating Marketing Effectiveness
Are you struggling to see how your marketing efforts translate into actual sales? The conversion rate is one of the key performance indicators (KPIs) examples that measures this by dividing conversions, such as sales or sign-ups, by the total number of visitors to your website or landing page. You need to assess how effectively your marketing efforts translate into tangible customer actions. By examining your conversion rates, you can identify which marketing channels yield the best results, enabling you to refine your strategies and boost your ROI.
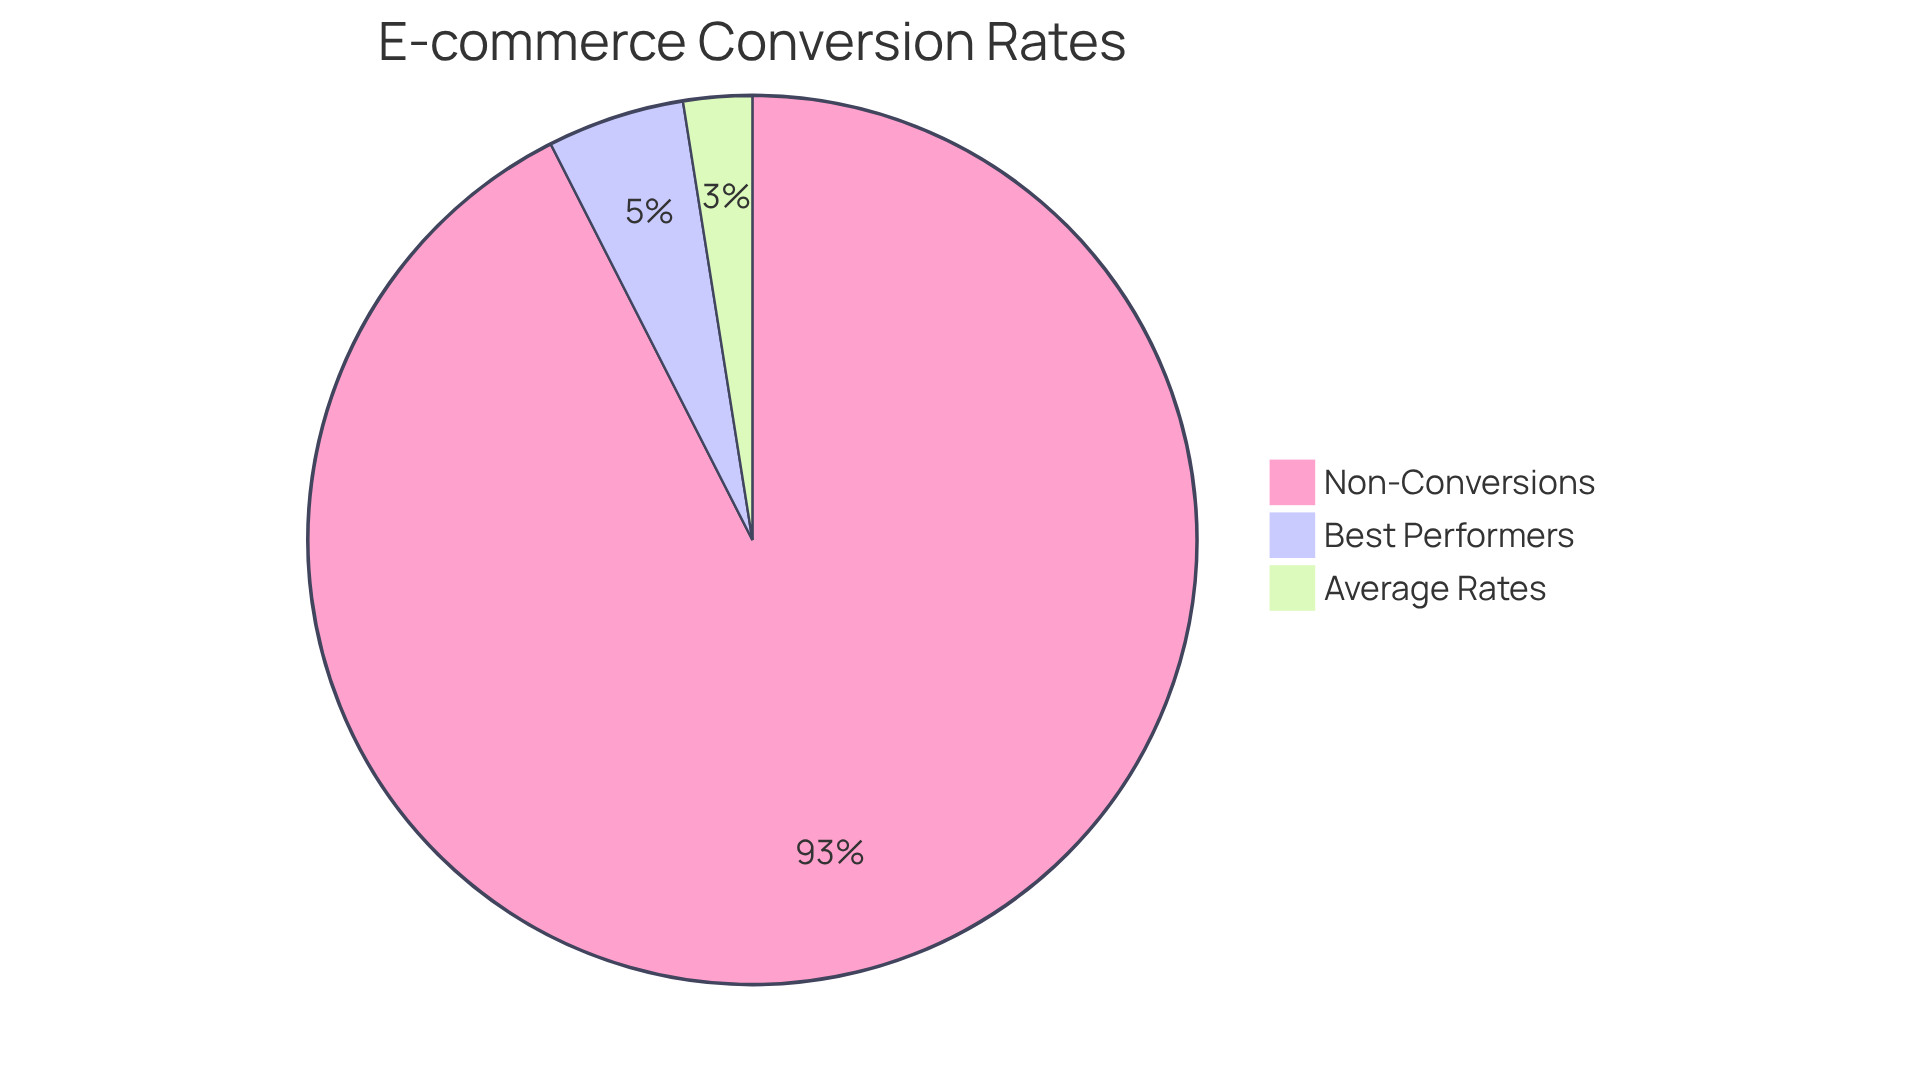
In 2026, e-commerce sites are seeing average conversion rates of 2-3%, while the best performers exceed 5%. What does this mean for you? It underscores the importance of targeted marketing strategies. Understanding conversion rates allows you to make data-driven adjustments, like A/B testing and improving user experience, which are crucial for enhancing key performance indicators KPIs examples.
Recognizing that even a one-second delay in page speed can significantly impact conversions is vital. With online shopping cart abandonment rates rising in 2026, effective conversion strategies are more important than ever.
Average Deal Size: Understanding Revenue Potential
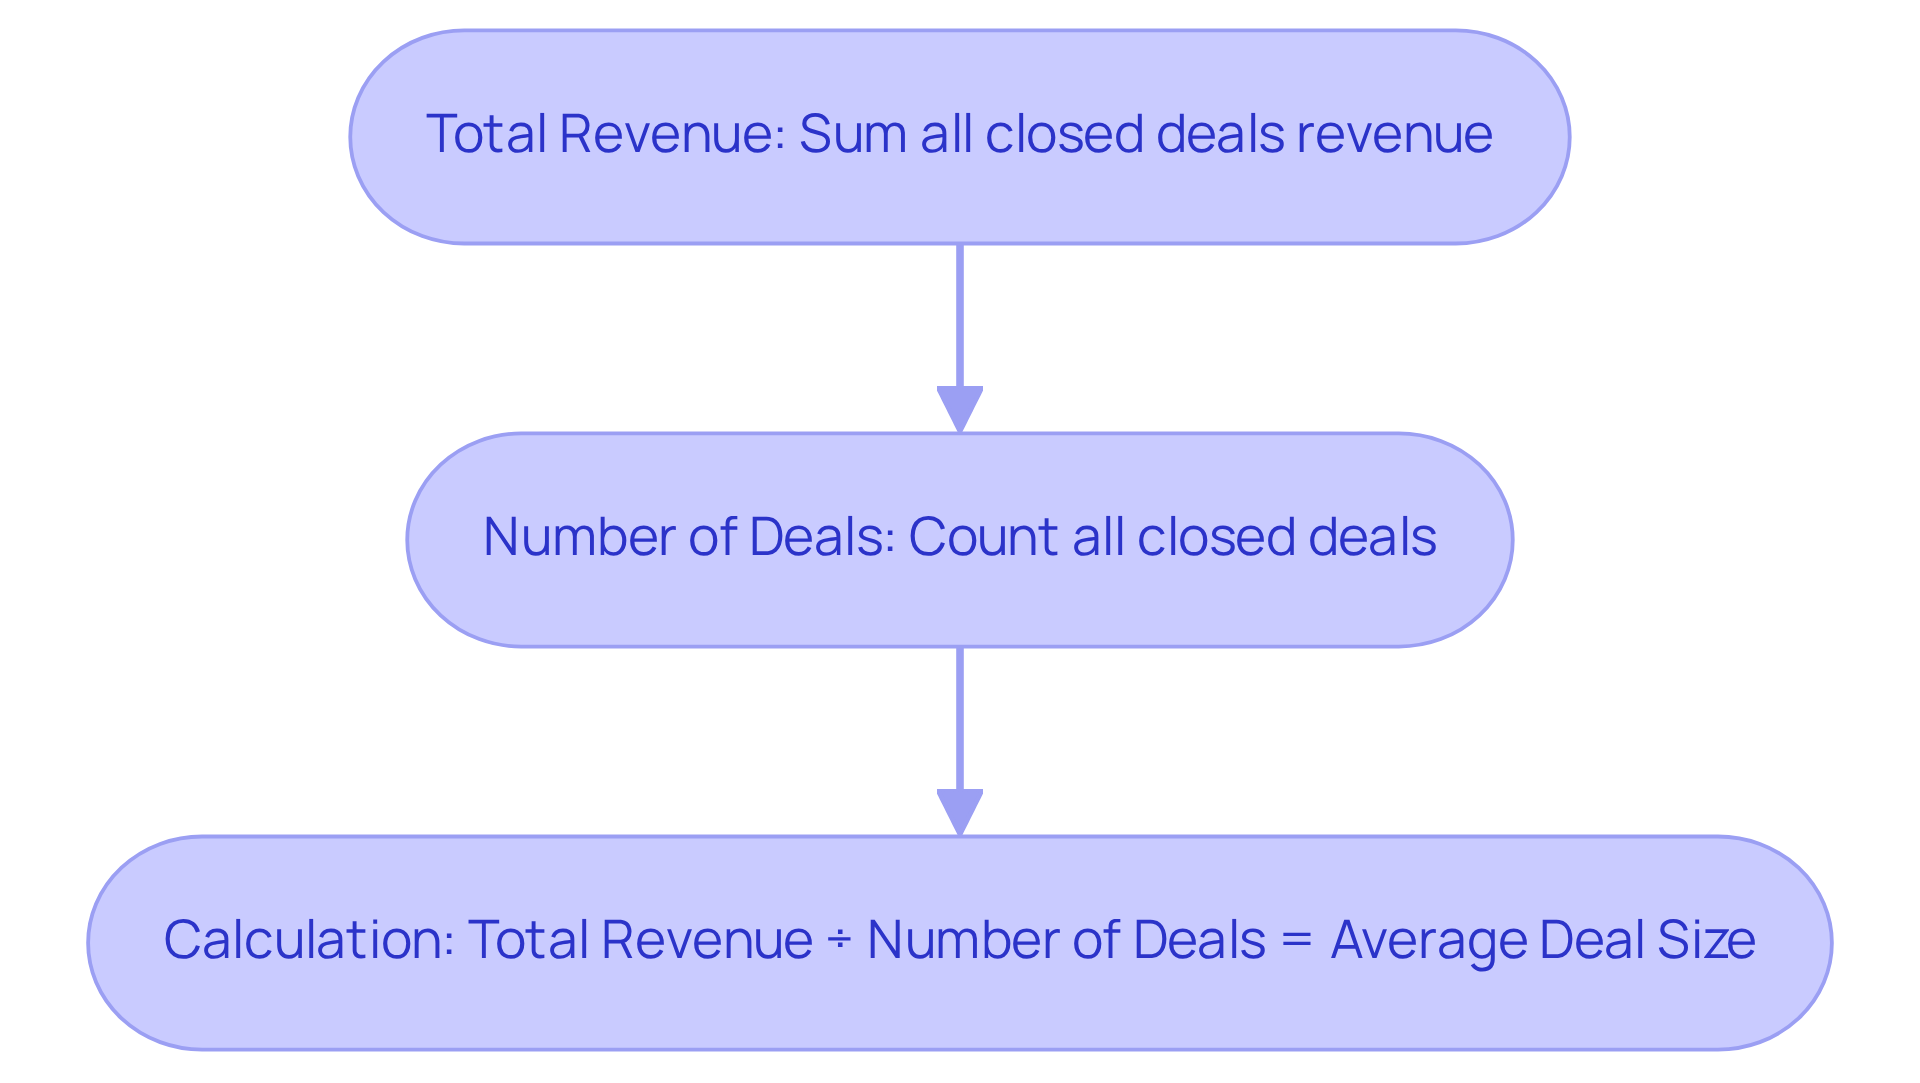
Are you struggling to pinpoint the financial impact of your sales transactions? Average Deal Size is calculated by dividing the total revenue generated from closed deals by the number of deals closed during a specific period. Understanding Average Deal Size is crucial for you to gauge the financial impact of your sales transactions and set effective benchmarks for future efforts. By monitoring Average Deal Size, you can identify opportunities to increase revenue through upselling or cross-selling strategies. For instance, MAP Consulting has successfully helped clients like Wilbur-Ellis and Mountain Valley Express enhance their sales and profitability through disciplined accountability and strategic vision. By adhering to MAP principles, Mountain Valley Express achieved annual profit margins between 5-8% and revenue growth of up to 27%. These impressive results underscore why grasping and improving Average Deal Size is vital for your organization’s success.
To effectively calculate Average Deal Size, organizations should consider the following steps:
- Total Revenue: Sum the revenue from all closed deals during the selected period.
- Number of Deals: Count the total number of deals closed in the same timeframe.
- Calculation: Divide the total revenue by the number of deals to obtain the Average Deal Size.
Customer Lifetime Value (CLV): Estimating Long-Term Profitability
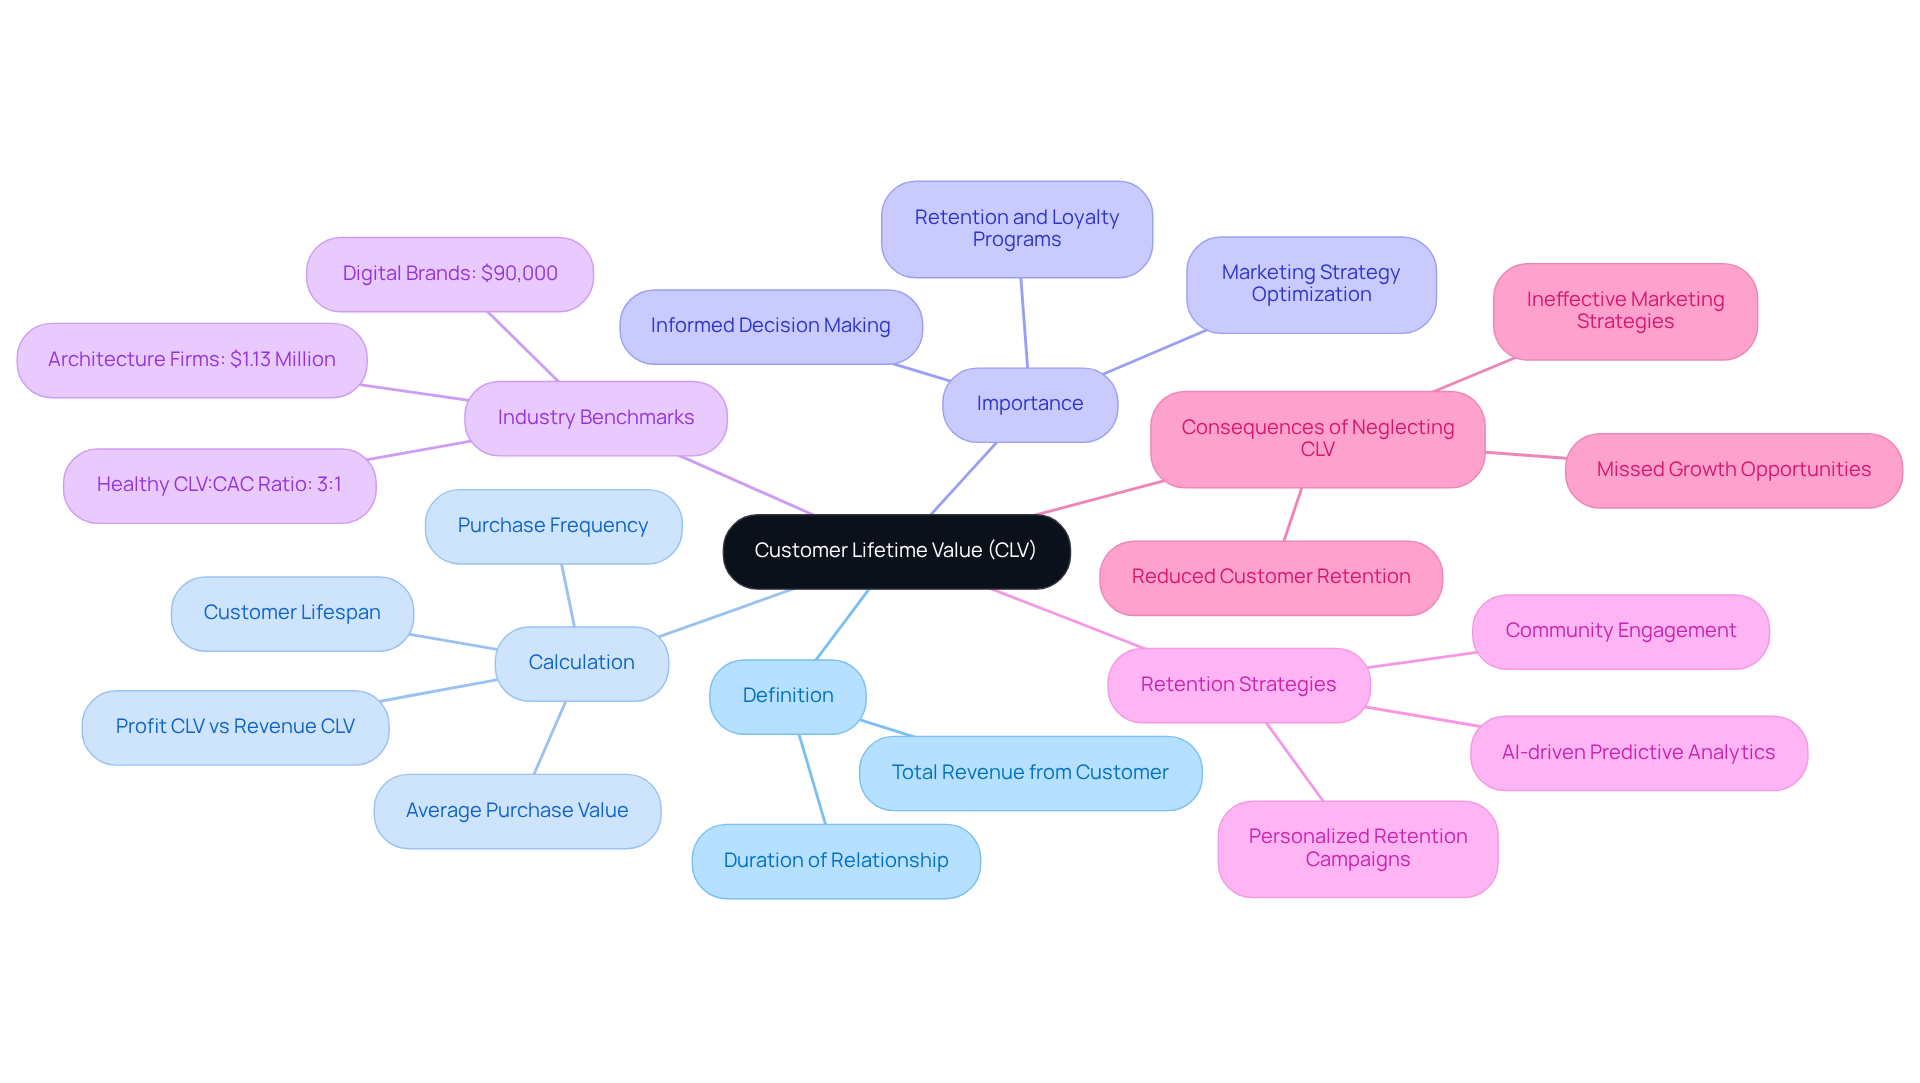
Are you truly aware of the long-term value your customers bring to your business? Customer Lifetime Value (CLV) estimates the total revenue you can anticipate from a client over the duration of their relationship. It’s calculated by multiplying the average purchase value by the average purchase frequency and the average lifespan of a client. Understanding CLV is vital for you to make informed decisions about acquiring and retaining clients. Normalizing for acquisition periods is crucial, as seasonal spikes in customer acquisition can significantly affect long-term CLV.
As we look to 2026, how can you leverage advanced estimation techniques for CLV to stay ahead? Businesses are advised to adopt AI-driven predictive analytics to enhance accuracy. Companies utilizing these methods can achieve a 25-40% improvement in prediction accuracy compared to traditional models, enabling them to personalize retention and loyalty programs effectively. Current benchmarks indicate that a healthy CLV-to-Customer Acquisition Cost (CAC) ratio should ideally be at least 3:1, with top-performing companies achieving ratios as high as 5:1.
Industry-specific CLV benchmarks reveal significant variations; for instance, architecture firms average a CLV of $1.13 million, while digital brands average around $90,000. This disparity underscores the importance of tailoring strategies to specific market conditions.
Furthermore, enhancing client retention by merely 5% can result in profit growth of 25% to 95%, emphasizing the financial advantages of concentrating on CLV. Case studies illustrate the practical application of CLV calculations. For instance, companies that invest in first-party data for CLV modeling obtain a competitive advantage in personalization and client retention. Moreover, companies that adopt community-driven development approaches observe engaged community members attaining 2-3 times greater lifetime values than non-participants, highlighting the importance of involvement.
Neglecting CLV can result in missed opportunities for growth and profitability. By concentrating on CLV, you can improve your marketing strategies, boost customer retention, and ultimately drive sustainable development.
Return on Investment (ROI): Measuring Profitability of Investments
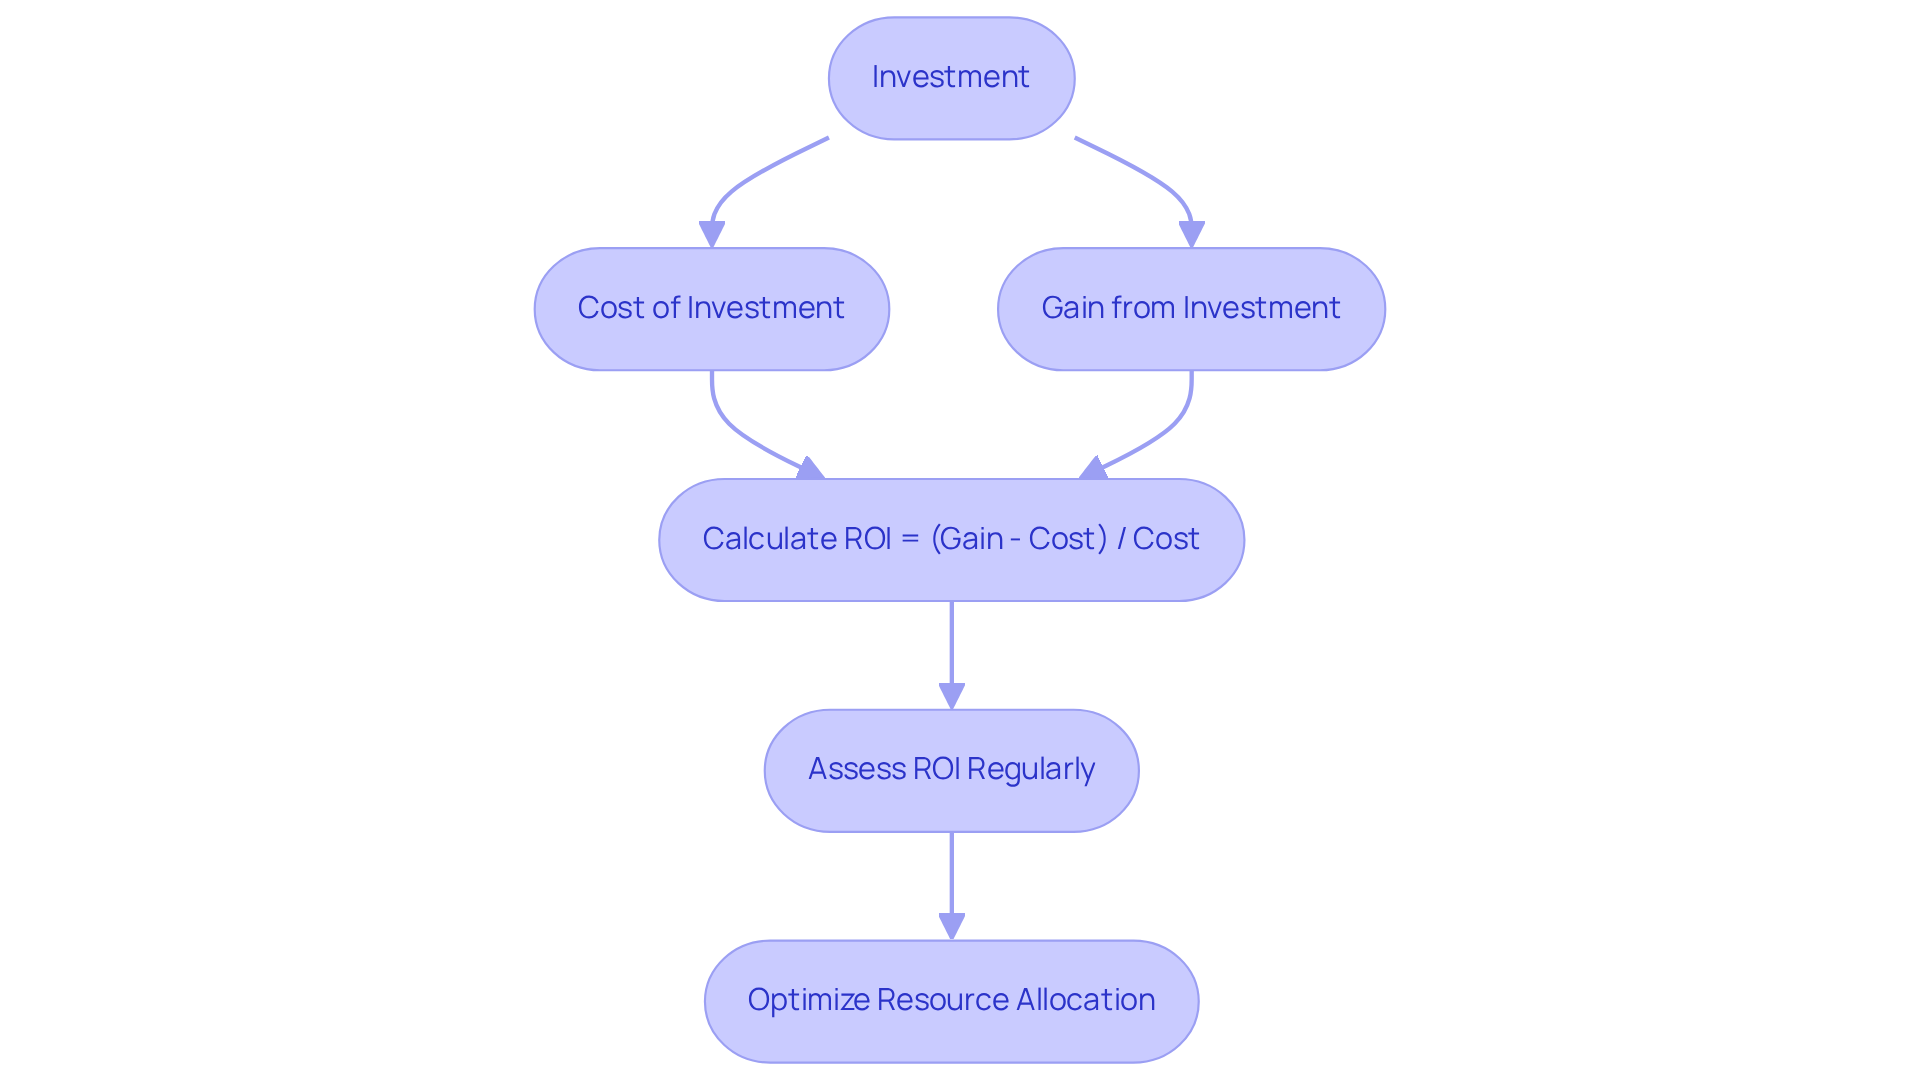
Are you struggling to make sense of your investments and their returns? Understanding Return on Investment (ROI) is key. It’s simply the gain from your investment minus its cost, divided by that cost. When you regularly assess ROI, you can pinpoint which investments yield the highest returns and optimize your resource allocation accordingly.
Take Mountain Valley Express, for example. By embracing MAP principles, they not only achieved annual profit margins of 5-8% but also saw revenue growth soar by up to 27%. This showcases the remarkable financial outcomes that can be achieved through disciplined coaching and strategic investment. So, what’s your next move?
Website Bounce Rate: Assessing User Engagement Online
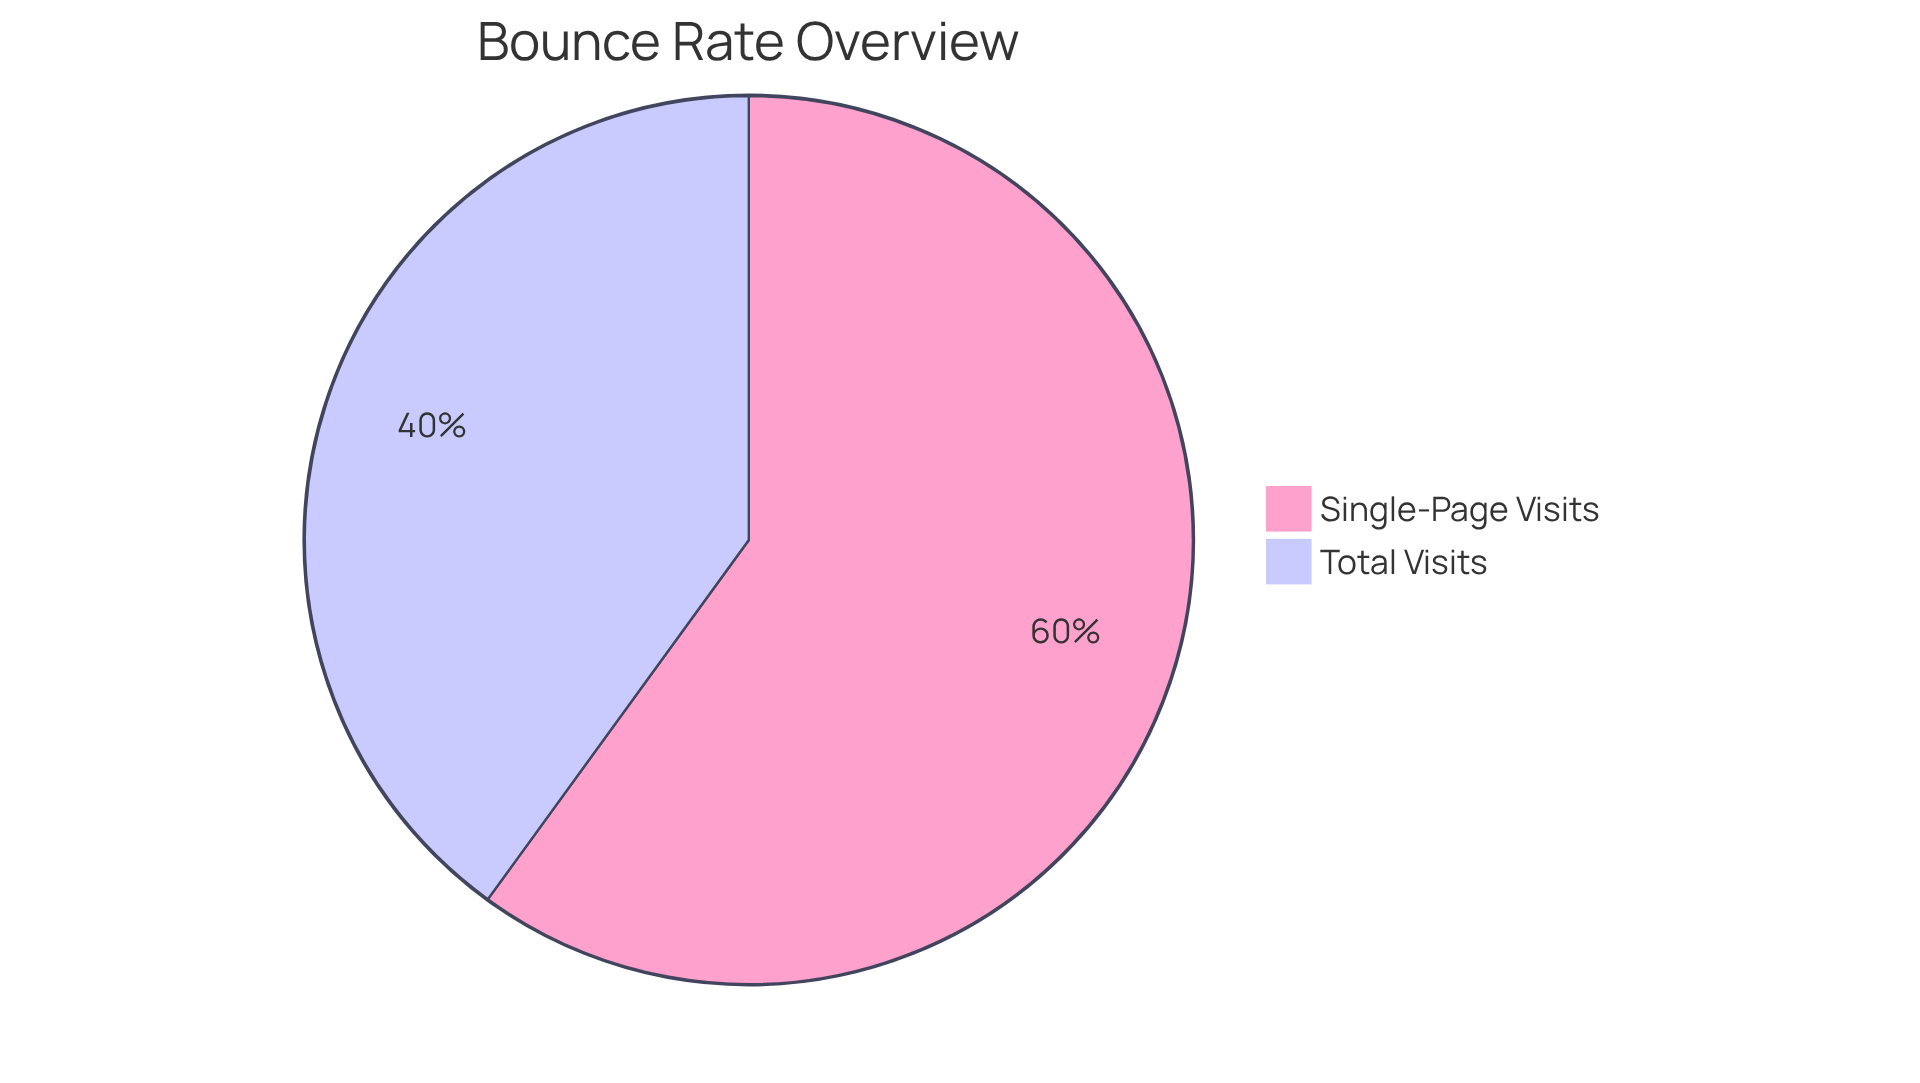
Are you frustrated by visitors leaving your website without engaging further? The bounce rate, calculated by dividing single-page visits by total visits, is an important measure among key performance indicators (KPIs) examples to consider. When your bounce rate is high, it often means visitors are leaving without exploring more of your content. This could signal underlying issues with user experience or the relevance of your content to their needs.
To turn this around, monitor your bounce rates closely. Identify areas for improvement, optimize your website, and enhance user engagement to keep visitors coming back for more.
Conclusion
Are you still relying on generic metrics to measure success? Tailored KPIs are essential for capturing your unique objectives and challenges. Understanding and implementing key performance indicators (KPIs) is crucial for any organization aiming for sustained success. When you focus on customized KPIs, you enhance accountability, align your strategies with your goals, and drive growth effectively.
Throughout this discussion, we explored various KPIs, including:
- Customer Acquisition Cost (CAC)
- Net Promoter Score (NPS)
- Monthly Recurring Revenue (MRR)
- Employee Engagement Score
Each metric serves a distinct purpose, providing insights into different aspects of business performance. For instance, CAC helps you understand marketing efficiency, while MRR offers a glimpse into financial stability. These metrics guide your decision-making and strategic planning, making them indispensable for your success.
In conclusion, organizations must prioritize the development and monitoring of tailored KPIs to navigate the complexities of today’s business landscape. This misalignment can result in stagnation and a failure to adapt in a rapidly changing business environment. By leveraging insights from MAP Consulting’s expertise, businesses can create a robust framework for measuring success and driving performance. Failing to act on this now could mean falling behind in a competitive landscape where tailored insights are crucial for survival.
Frequently Asked Questions
What is the importance of tailored key performance indicators (KPIs) for organizations?
Tailored KPIs are crucial for accurately measuring an organization’s success, aligning strategies with unique objectives, and enhancing team accountability, which drives sustainable growth.
How can customized KPIs impact business performance?
Customized KPIs help organizations improve alignment with strategic goals, leading to increased customer loyalty and repeat transactions, which are essential for long-term success.
Can you provide an example of how tailored KPIs have benefited an organization?
MAP Consulting’s collaboration with AbilityFirst resulted in a significant increase in summer camp enrollment, showcasing how tailored KPIs can drive operational efficiency and growth.
What is Client Acquisition Cost (CAC) and why is it important?
CAC is calculated by dividing total sales and marketing expenses by the number of new clients gained in a specific period. It is important for understanding how much a company spends on acquiring each new customer.
How does CAC vary across different industries?
For example, the average CAC in Financial Services is $784, while in eCommerce it is $274. This variation highlights the need for industry-specific strategies in managing acquisition costs.
What is a healthy LTV:CAC ratio for businesses?
A healthy LTV:CAC ratio is around 3:1, which ensures that a company can cover acquisition costs while still investing in growth.
How can enhancing retention rates affect CAC efficiency?
Improving retention rates can significantly enhance CAC efficiency, as current clients generate 65% of a company’s revenue, and a 5% increase in retention may boost earnings by 25-95%.
What innovative strategies can help reduce CAC?
Strategies such as predictive lead scoring can decrease sales development representative cycles on poor-fit leads by 30-40%, resulting in a 15-18% reduction in CAC.
What is the Net Promoter Score (NPS) and how is it used?
NPS measures customer loyalty by asking clients how likely they are to recommend a company’s products or services. A high NPS indicates loyal advocates, while a low score may signal underlying issues.
Why should organizations regularly evaluate their NPS?
Regular evaluation of NPS is vital for gaining insights into client satisfaction and making informed decisions to enhance offerings.
List of Sources
- MAP Consulting: Tailored KPI Development for Business Success
- The power of KPIs for business growth – Mel – Management & eLearning (https://blogs.uoc.edu/mel/the-power-of-kpis-for-business-growth)
- How to build a KPI dashboard for your consulting business | Melisa Liberman posted on the topic | LinkedIn (https://linkedin.com/posts/melisa-liberman_independentconsulting-growyourindependentconsultingbusinesspodcast-activity-7310678611638816769-44Ob)
- KPIs for Business Growth in 2026: The Implementation Guide (https://spiderstrategies.com/blog/kpi-business-growth)
- How to measure success: Key performance indicators for consultants (https://wrike.com/blog/measuring-success-for-consultants)
- 10 Key Performance Indicator KPI Examples for Business Growth (https://mapconsulting.com/10-key-performance-indicator-kpi-examples-for-business-growth)
- Customer Acquisition Cost (CAC): Measuring Marketing Efficiency
- Rising B2B Customer Acquisition Costs in 2026 & Why It’s Happening & How To Fix It (https://linkedin.com/pulse/rising-b2b-customer-acquisition-costs-2026-why-its-pierson-p-e–h8sic)
- Average Customer Acquisition Cost (CAC) Industry Benchmarks (2026) (https://userpilot.com/blog/average-customer-acquisition-cost)
- Customer Acquisition Statistics & Trends You Should Not Miss – Management.org (https://management.org/customer-acquisition-statistics)
- Customer Acquisition Cost Trends: 2026 Report – Focus Digital (https://focus-digital.co/customer-acquisition-cost-trends)
- Customer Acquisition Cost Benchmarks 2026: By Industry (https://digitalapplied.com/blog/customer-acquisition-cost-benchmarks-2026-industry)
- Net Promoter Score (NPS): Assessing Customer Loyalty and Satisfaction
- Improve Net Promoter Score in 2026 | 9 Proven NPS Strategies (https://chattermill.com/blog/how-to-improve-net-promoter-score)
- What Is a Good Net Promoter Score? NPS Benchmarks by Industry. (https://npsprism.com/good-net-promoter-score)
- NPS Benchmarks 2026: Net Promoter Score by Industry (Complete Reference) (https://koji.so/docs/nps-benchmarks-by-industry-2026)
- Net Promoter Score in 2026: Using a Familiar Metric More Effectively (https://linkedin.com/pulse/net-promoter-score-2026-using-familiar-metric-more-effectively-1x7tc)
- NPS Scores by Industry: 2026 Benchmarks & What’s a Good Score | Sybill (https://sybill.ai/blogs/nps-scores-of-companies-2026-benchmarks-industry-standards-and-how-to-calculate-your-net-promoter-score)
- Monthly Recurring Revenue (MRR): Ensuring Financial Stability
- Mastering Monthly Recurring Revenue: A Comprehensive Guide (https://billingplatform.com/blog/what-is-monthly-recurring-revenue-mrr)
- 40 Subscription Commerce Statistics for 2025: Growth Trends, Revenue Benchmarks & Retention Insights | Swell (https://swell.is/content/subscription-commerce-statistics)
- 10 Proven Strategies to Boost Net MRR Growth in 2026 – CloudTalk (https://cloudtalk.io/blog/mrr-growth)
- Subscription Commerce 2026: Recurring Revenue Guide (https://digitalapplied.com/blog/subscription-commerce-2026-recurring-revenue-guide)
- What Is a Good Monthly Recurring Revenue Growth Rate for a Business? | Consero (https://conseroglobal.com/resources/what-is-a-good-monthly-recurring-revenue-growth-rate-for-a-business)
- Employee Engagement Score: Measuring Workforce Morale and Productivity
- Employee engagement dips, which Gallup says costs economy billions in lost productivity (https://foxbaltimore.com/news/nation-world/employee-engagement-dips-which-gallup-says-costs-economy-billions-in-lost-productivity-gallup-state-of-the-global-workplace-report-importance-of-managers-on-employee-engagement)
- What 23 Million Employees Say About Engagement in 2026 (https://blog.perceptyx.com/what-23-million-employees-say-about-engagement-in-2026)
- State of the Global Workplace Report (https://gallup.com/workplace/349484/state-of-the-global-workplace.aspx)
- 55 employee engagement statistics for 2026 (latest data) (https://worktime.com/blog/statistics/employee-engagement-statistics-latest-data)
- US Employee Engagement Remains Steady in 2026 | Gallup posted on the topic | LinkedIn (https://linkedin.com/posts/gallup_during-the-first-half-of-2026-31-of-us-activity-7496181823849373696-Xa–)
- Conversion Rate: Evaluating Marketing Effectiveness
- Why Conversion Rate Optimization Matters for Business | Lucky Orange (https://luckyorange.com/blog/posts/why-conversion-rate-optimization-matters)
- Conversion Rate: Why it Matters to Business (https://amplitude.com/explore/metrics/conversion-rate-guide)
- Global conversion rate by industry 2026 | Statista (https://statista.com/statistics/1106713/global-conversion-rate-by-industry-and-device?srsltid=AU7gw4Vy2GrDuy96QWMrg8Xbw0UOcWNzVhXL5l3HTFvtXpN7Tkqt616V)
- Why conversion rate optimisation is more important than ever: In the last 9 months, our SEO visibility (positions in the SERPs) and so – impressions have been improving by roughly 6.47% month over… | Emilia Korczynska (https://linkedin.com/posts/emiliakorczynska_why-conversion-rate-optimisation-is-more-activity-7376329374351929344-xmF9)
- Average Deal Size: Understanding Revenue Potential
- Average deal size for private SaaS Companies (https://saas-capital.com/blog-posts/what-is-the-average-deal-size-for-private-saas-companies)
- Global M&A industry trends: 2026 mid-year outlook (https://pwc.com/gx/en/services/deals/trends.html)
- DealMakers Q2 2026 (https://friedfrank.com/news-and-insights/dealmakersQ2-2026-13077)
- US Deals 2026 midyear outlook (https://pwc.com/us/en/services/consulting/deals/outlook.html)
- Customer Lifetime Value (CLV): Estimating Long-Term Profitability
- Why Do Companies Focus on Customer Lifetime Value (CLV) Now? – Luth Research (https://luthresearch.com/glossary/why-do-companies-focus-on-customer-lifetime-value-clv-now)
- How businesses can use customer lifetime value (CLV) to boost revenue and loyalty in 2026 (https://kleene.ai/blog/clv)
- Customer Lifetime Value: Benchmarks & Drivers to Know in 2026 (https://emarsys.com/learn/blog/customer-lifetime-value-benchmarks-drivers)
- Customer Lifetime Value Benchmarks 2026: Industry Data (https://digitalapplied.com/blog/customer-lifetime-value-benchmarks-2026-industry-data)
- Customer Lifetime Value Growth — 30 Statistics Every Marketing Leader Should Know in 2026 (https://genesysgrowth.com/blog/clv-growth-stats-for-marketing-leaders)
- Return on Investment (ROI): Measuring Profitability of Investments
- A Closer Look at Understanding Business ROI: A Quick Guide (https://demo.gae.org/gae-news/understanding-business-roi-a-quick-guide-1767646901)
- Maximizing Business Success: Understanding Return on Investment (ROI) (https://mitratech.com/resource-hub/blog/maximizing-business-success-understanding-return-on-investment-roi)
- 2026 Marketing Statistics, Trends, & Data (https://hubspot.com/marketing-statistics)
- ROI in Business: Significance and Strategic Applications (https://zinfi.com/glossary/what-is-roi-in-business)
- Discover the Importance of ROI for Business Decision-Making (https://onlinedegrees.siu.edu/programs/business/mba/finance/importance-of-roi-in-decision-making)
- Website Bounce Rate: Assessing User Engagement Online
- Top 50 Website Traffic Statistics: Key Stats for 2026 | Wingify (https://wingify.com/blog/website-traffic-statistics)
- Bounce Rate Statistics 2026 – 49 Facts That Will Surprise You (https://mycodelesswebsite.com/bounce-rate-statistics)
- Bounce Rate Benchmarks 2026: Industry and Channel Data (https://digitalapplied.com/blog/bounce-rate-benchmarks-2026-industry-channel-data)
- Website Statistics 2026 – Exclusive Facts & Trends | Reboot Online (https://rebootonline.com/website-statistics)
- Bounce Rate Benchmarks: What’s a Good Bounce Rate, Anyway? (https://cxl.com/guides/bounce-rate/benchmarks)


