10 Key Performance Indicator KPI Examples for Business Growth
Introduction
Are you overwhelmed by the sheer number of performance metrics available to your business? As organizations navigate an increasingly competitive landscape, many leaders struggle to identify which metrics will actually drive their success. The ability to measure and analyze performance metrics can mean the difference between stagnation and thriving. This article delves into ten essential KPIs that not only provide insights into business health but also empower leaders to make informed decisions that drive sustainable growth. This confusion can lead to wasted resources and missed opportunities.
MAP Consulting: Transforming Business Success with Tailored KPIs
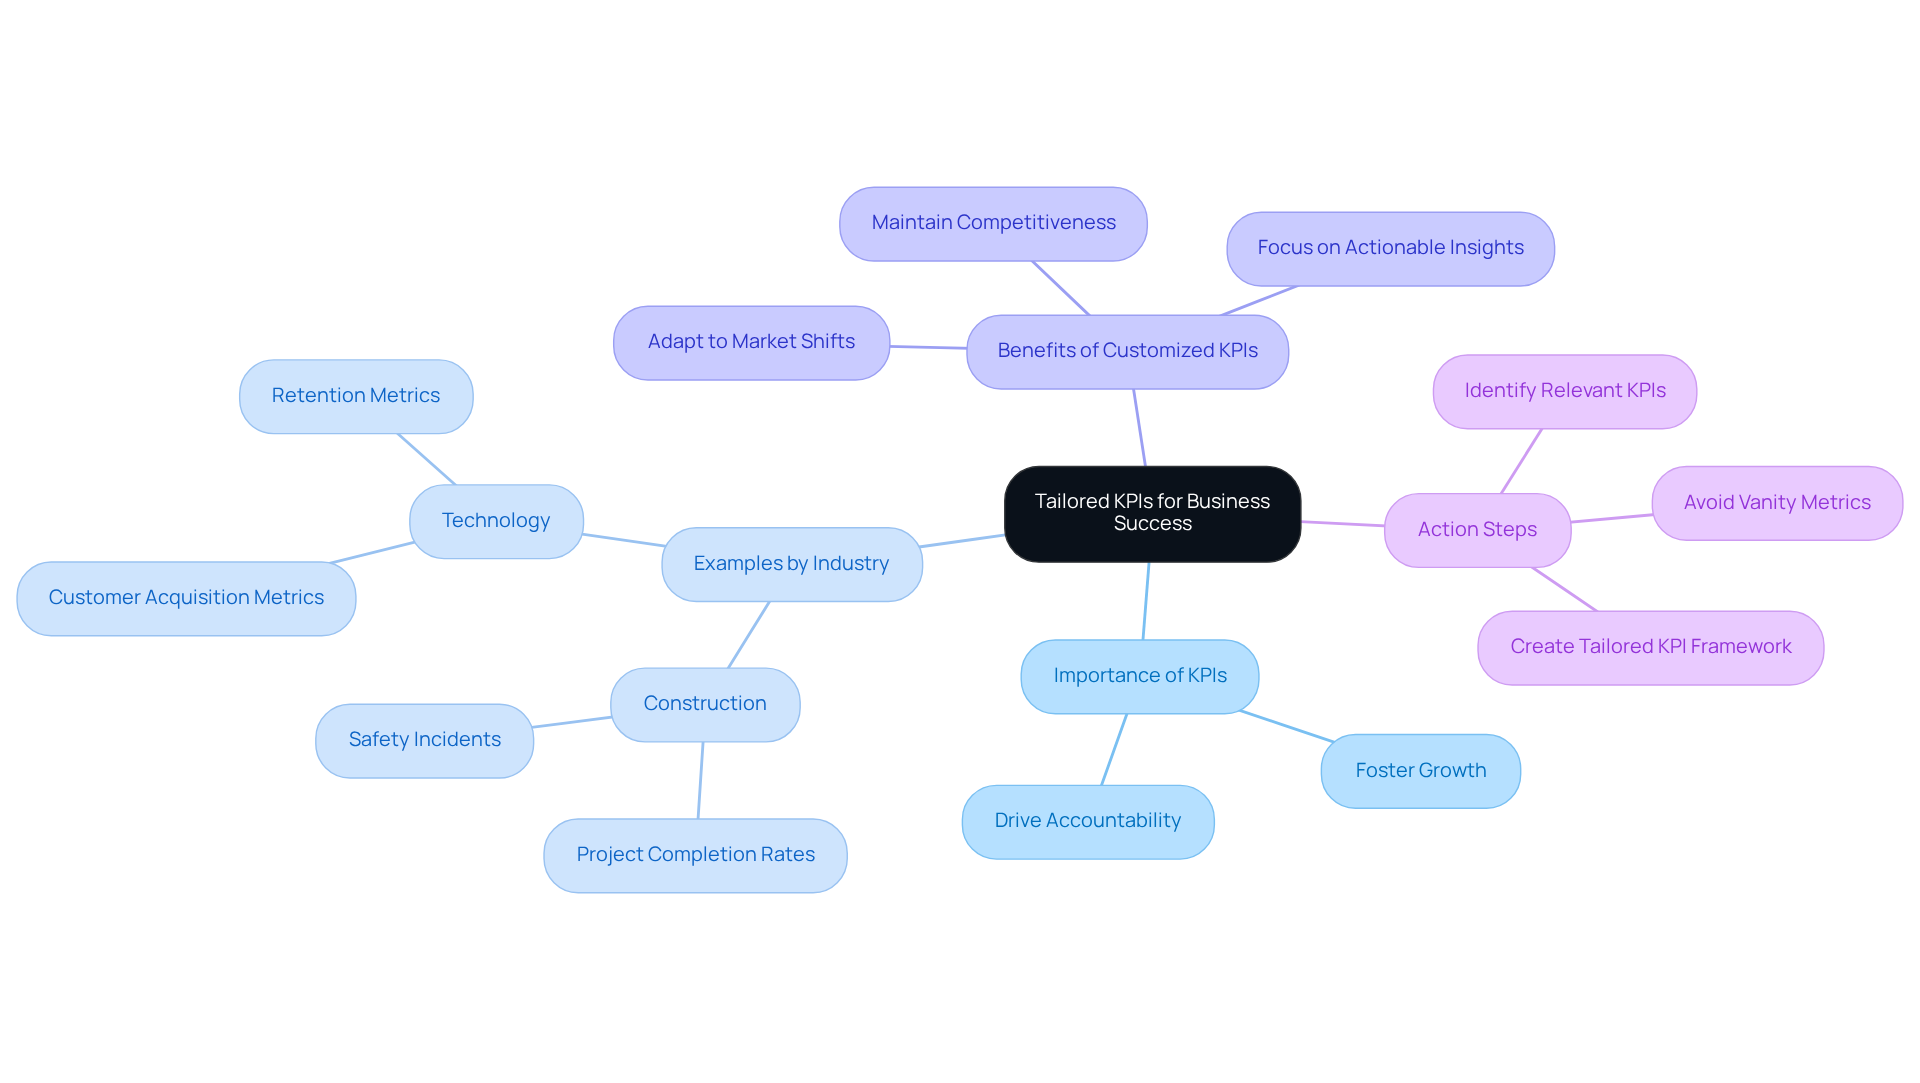
Are your KPIs truly driving your business forward, or are they just numbers on a report? The Disciplined Leader understands that key performance indicator KPI examples must be more than just numbers; they should drive accountability and foster sustainable growth. MAP Consulting excels in crafting customized Key Performance Indicators (KPIs) that align with your unique objectives and challenges. For instance, a construction firm may prioritize key performance indicator KPI examples related to project completion rates and safety incidents, while a technology company might focus on customer acquisition and retention metrics.
Do you recognize the critical role KPIs play in your business success? Organizations that implement tailored key performance indicator KPI examples can adapt to market shifts and maintain competitiveness, focusing on actionable insights rather than vanity metrics. By establishing a robust KPI infrastructure, you ensure that your metrics are not only relevant but also drive meaningful outcomes.
Case studies illustrate the effectiveness of customized KPIs in consulting firms. For instance, MAP Consulting has helped clients like Wilbur-Ellis create a strategic vision and disciplined accountability, resulting in enhanced sales and bottom-line profitability. Likewise, Mountain Valley Express, by following MAP principles, attained annual profit margins of 5-8% and revenue increases of up to 27%. Aligning key performance indicator KPI examples with your strategic objectives creates accountability and sharpens decision-making across your organization, ultimately leading to improved business performance.
As Dennis Najjar aptly states, “Key Performance Indicators (KPIs) are the tools that allow you to monitor the execution of your business plan, providing clear, data-driven insights into your company’s performance.” Additionally, avoiding vanity metrics is crucial for ensuring that KPIs remain actionable and focused on driving growth. Through MAP’s Accelerated Onsite Workshop, we can further develop your KPI frameworks, equipping your teams with essential management skills and fostering a culture of continuous improvement.
Take Action!
- Identify the KPIs that truly matter for your organization.
- Create a tailored KPI framework that aligns with your strategic goals.
- Stop measuring vanity metrics that do not drive growth.
Customer Satisfaction Score (CSAT): Measuring Client Happiness and Loyalty
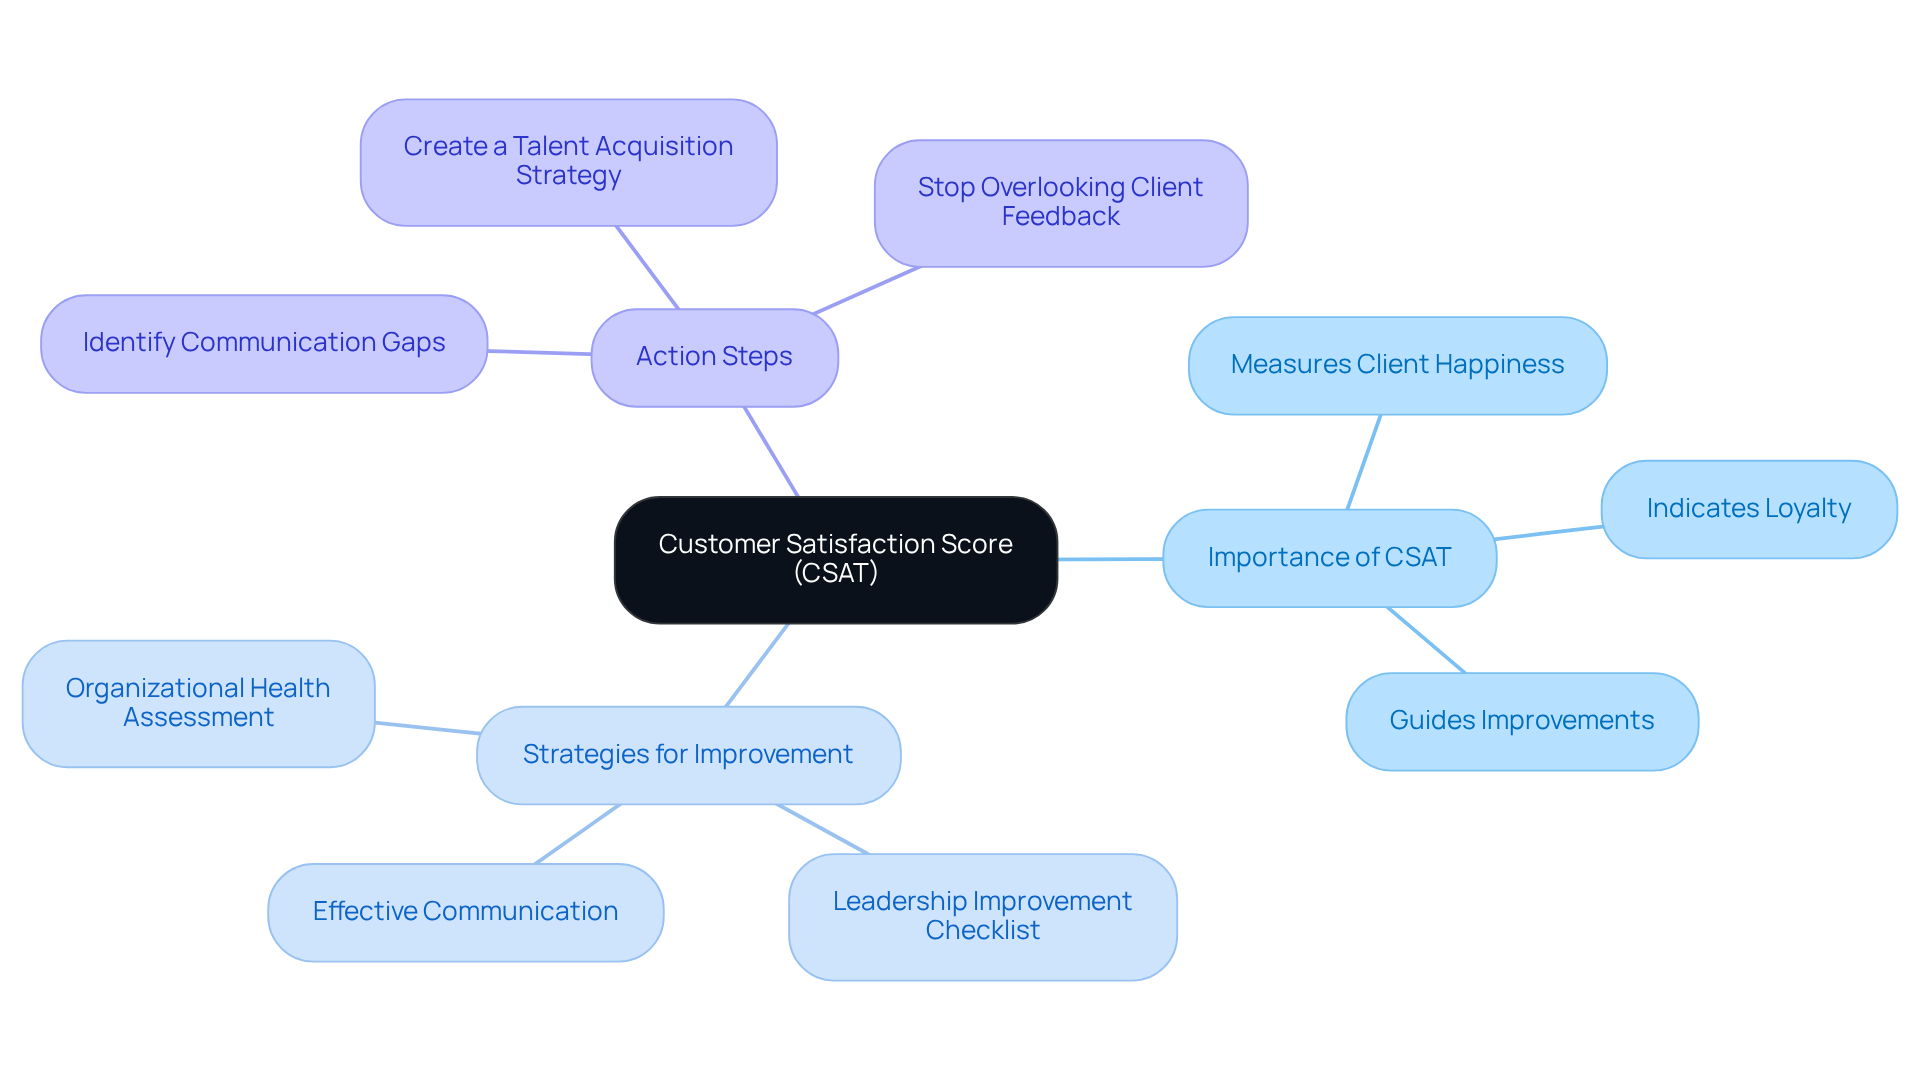
Are you truly aware of how your clients feel about your services? The Satisfaction Score (CSAT) is a vital key performance indicator (KPI) that assesses client satisfaction with your products or services. CSAT scores can reveal how happy your clients really are with your services and show you where to improve. A high CSAT score indicates strong client loyalty, leading to repeat business and referrals. For instance, a construction company might use CSAT to assess client satisfaction after project completion, allowing them to make necessary adjustments for future projects.
To enhance CSAT, MAP Consulting offers a comprehensive Organizational Health Assessment that identifies key areas for improvement. This evaluation, along with the Leadership Improvement Checklist, provides leaders with practical strategies to avoid common pitfalls that adversely affect client satisfaction. By prioritizing effective communication and talent acquisition, organizations can significantly enhance their CSAT scores and overall effectiveness.
Take action now:
- Identify communication gaps
- Create a talent acquisition strategy
- Stop overlooking client feedback
Net Promoter Score (NPS): Assessing Customer Loyalty and Advocacy
Are you truly aware of how your clients feel about your business? The Net Promoter Score (NPS) can reveal how likely your clients are to recommend your business. This single-question survey offers valuable insights into client sentiment and can forecast business expansion. A high NPS means you have a loyal group of clients ready to champion your brand.
Consider a healthcare provider who tracks NPS to understand patient satisfaction; this feedback can directly enhance service delivery and patient care. Ignoring client sentiment could mean losing out on valuable advocates for your brand.
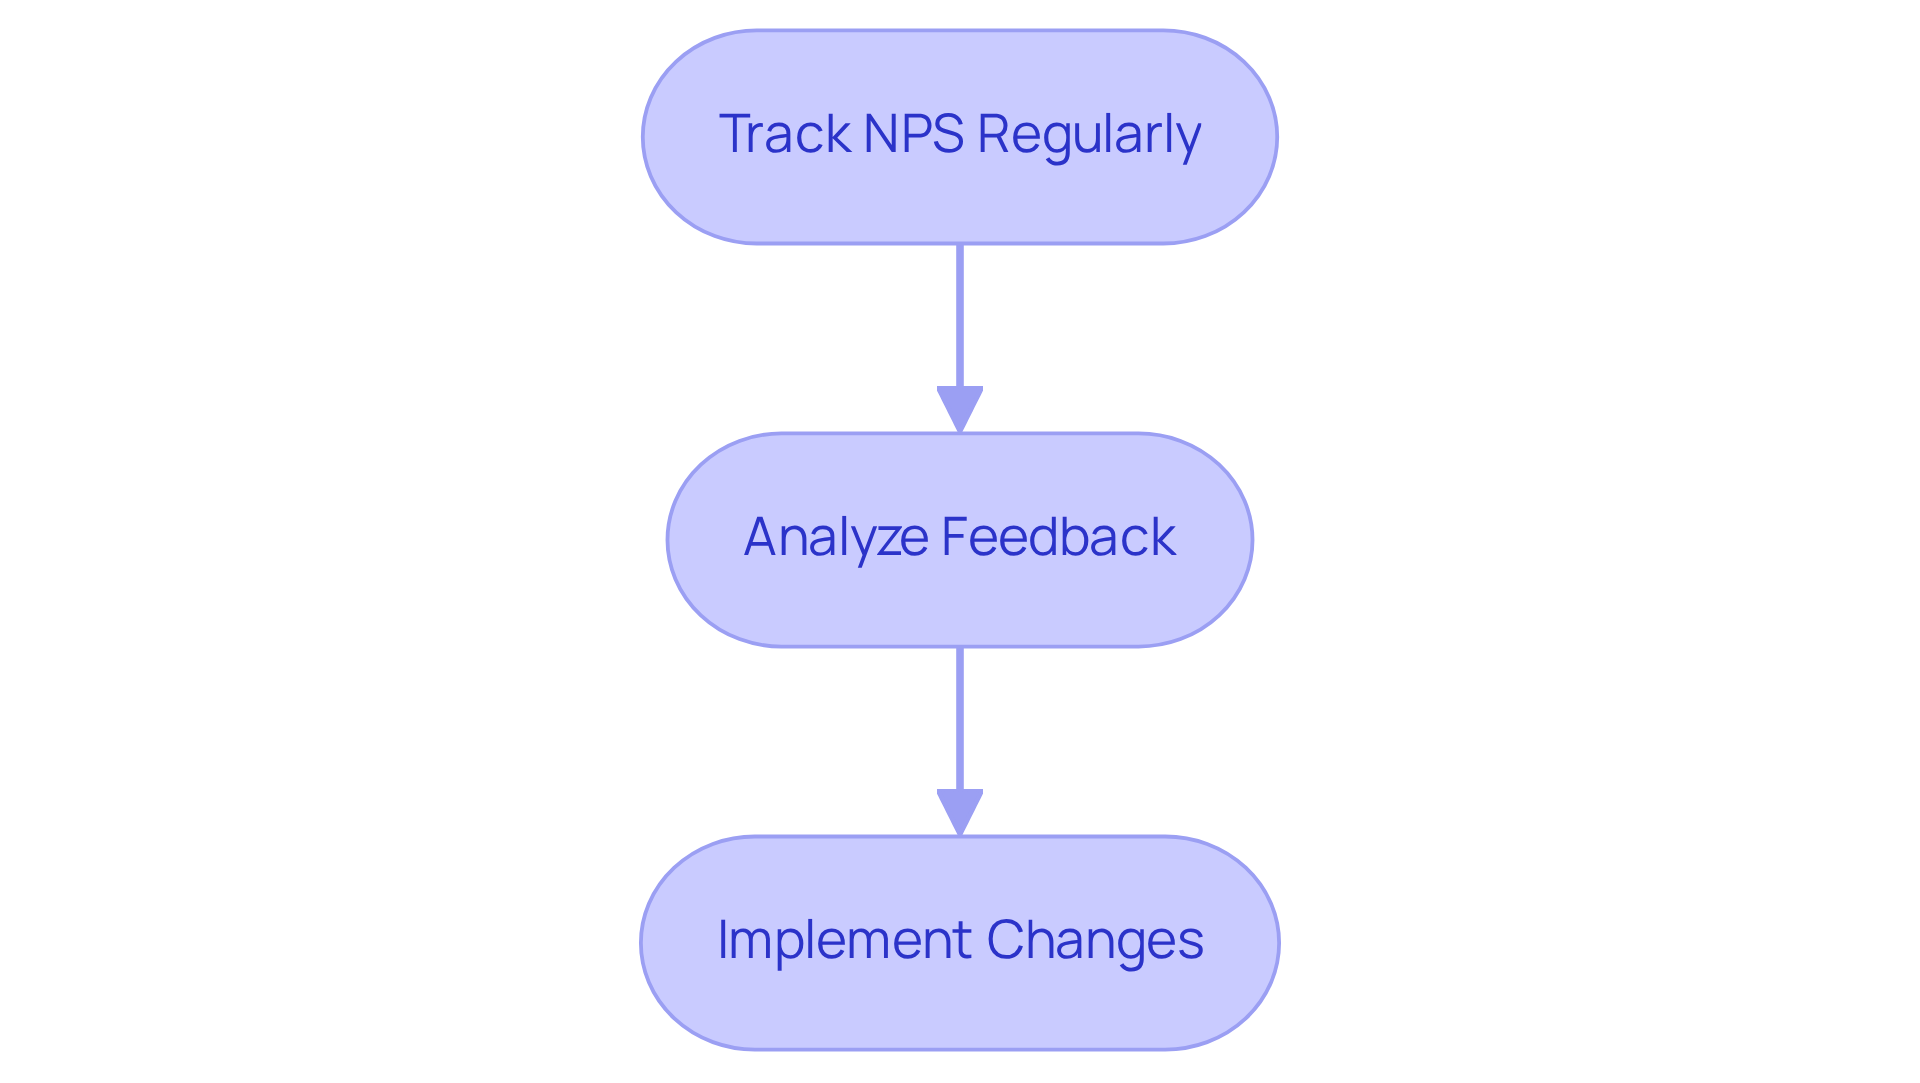
So, how can you leverage NPS? Start by:
- Tracking it regularly
- Analyzing the feedback
- Implementing changes based on what your clients are saying
Take Action!
Monthly Recurring Revenue (MRR): Tracking Financial Stability in Subscription Models
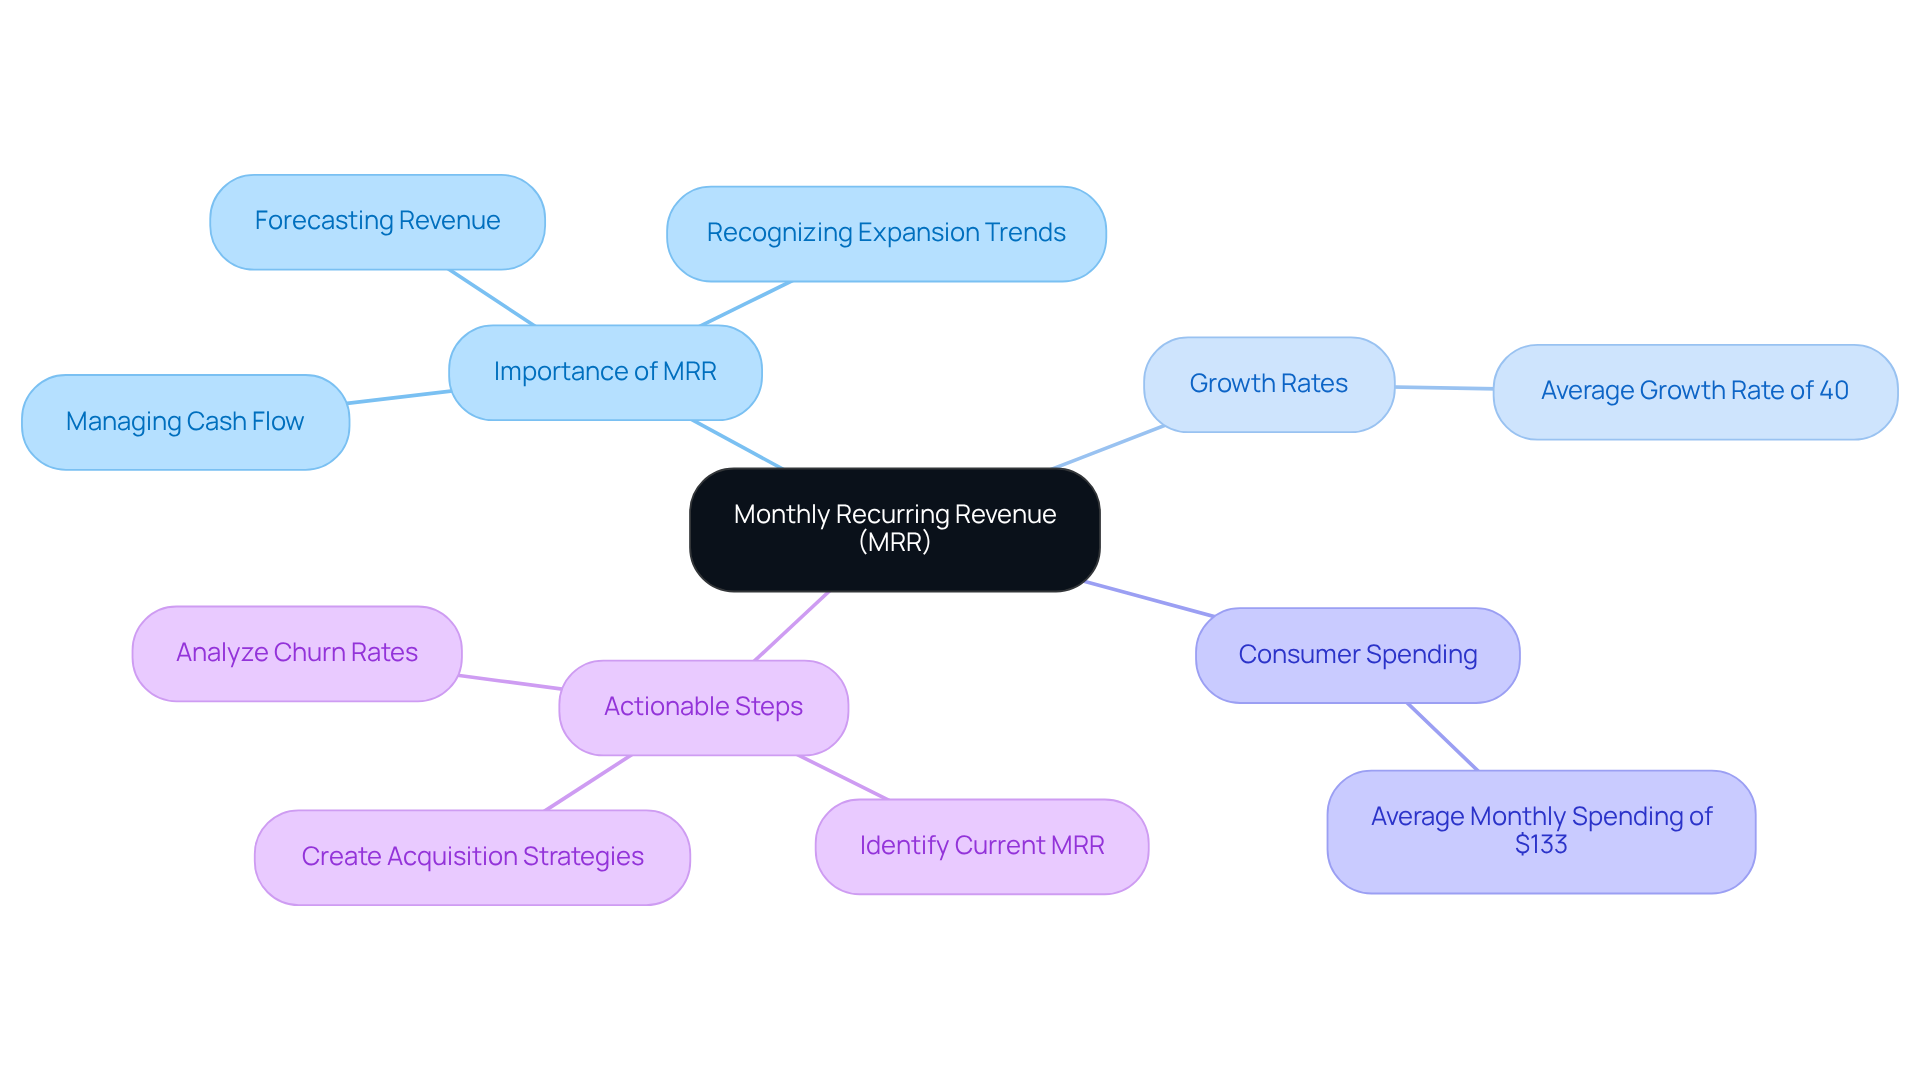
Are you struggling to predict your company’s financial future amidst fluctuating subscription rates? Monthly Recurring Revenue (MRR) is a key metric for subscription-based businesses, representing the predictable income generated from active subscriptions. How can MRR help you predict your company’s financial future? It allows businesses to forecast revenue, recognize expansion trends, and manage cash flow effectively. For instance, a SaaS company can evaluate the impact of customer churn and new acquisitions on its financial stability, enabling better strategic decisions regarding pricing and marketing.
In 2026, understanding MRR is crucial for sustaining financial stability and promoting sustainable development. Successful SaaS companies are experiencing average MRR growth rates of approximately 40%, reflecting a robust upward trajectory. Furthermore, with consumers spending an average of $133 monthly on subscriptions, the significance of MRR in comprehending market dynamics and buyer behavior cannot be overstated.
So, how do you leverage MRR for your business? Here’s a quick checklist:
- Identify your current MRR.
- Analyze churn rates.
- Create strategies for customer acquisition.
Take Action! Tackling challenges associated with churn and client acquisition is vital for enhancing MRR and securing long-term success in the subscription economy.
Customer Acquisition Cost (CAC): Evaluating Marketing Efficiency and Investment
Are you aware of how much it truly costs to acquire a new client? Customer Acquisition Cost (CAC) quantifies the total expenses incurred, including marketing and sales costs. You need to evaluate the effectiveness of your marketing strategies using key performance indicator (KPI) examples to ensure your client acquisition efforts yield a positive ROI. In the technology sector, companies analyze their CAC to assess the performance of their marketing campaigns effectively, allowing them to allocate resources more efficiently and enhance overall profitability.
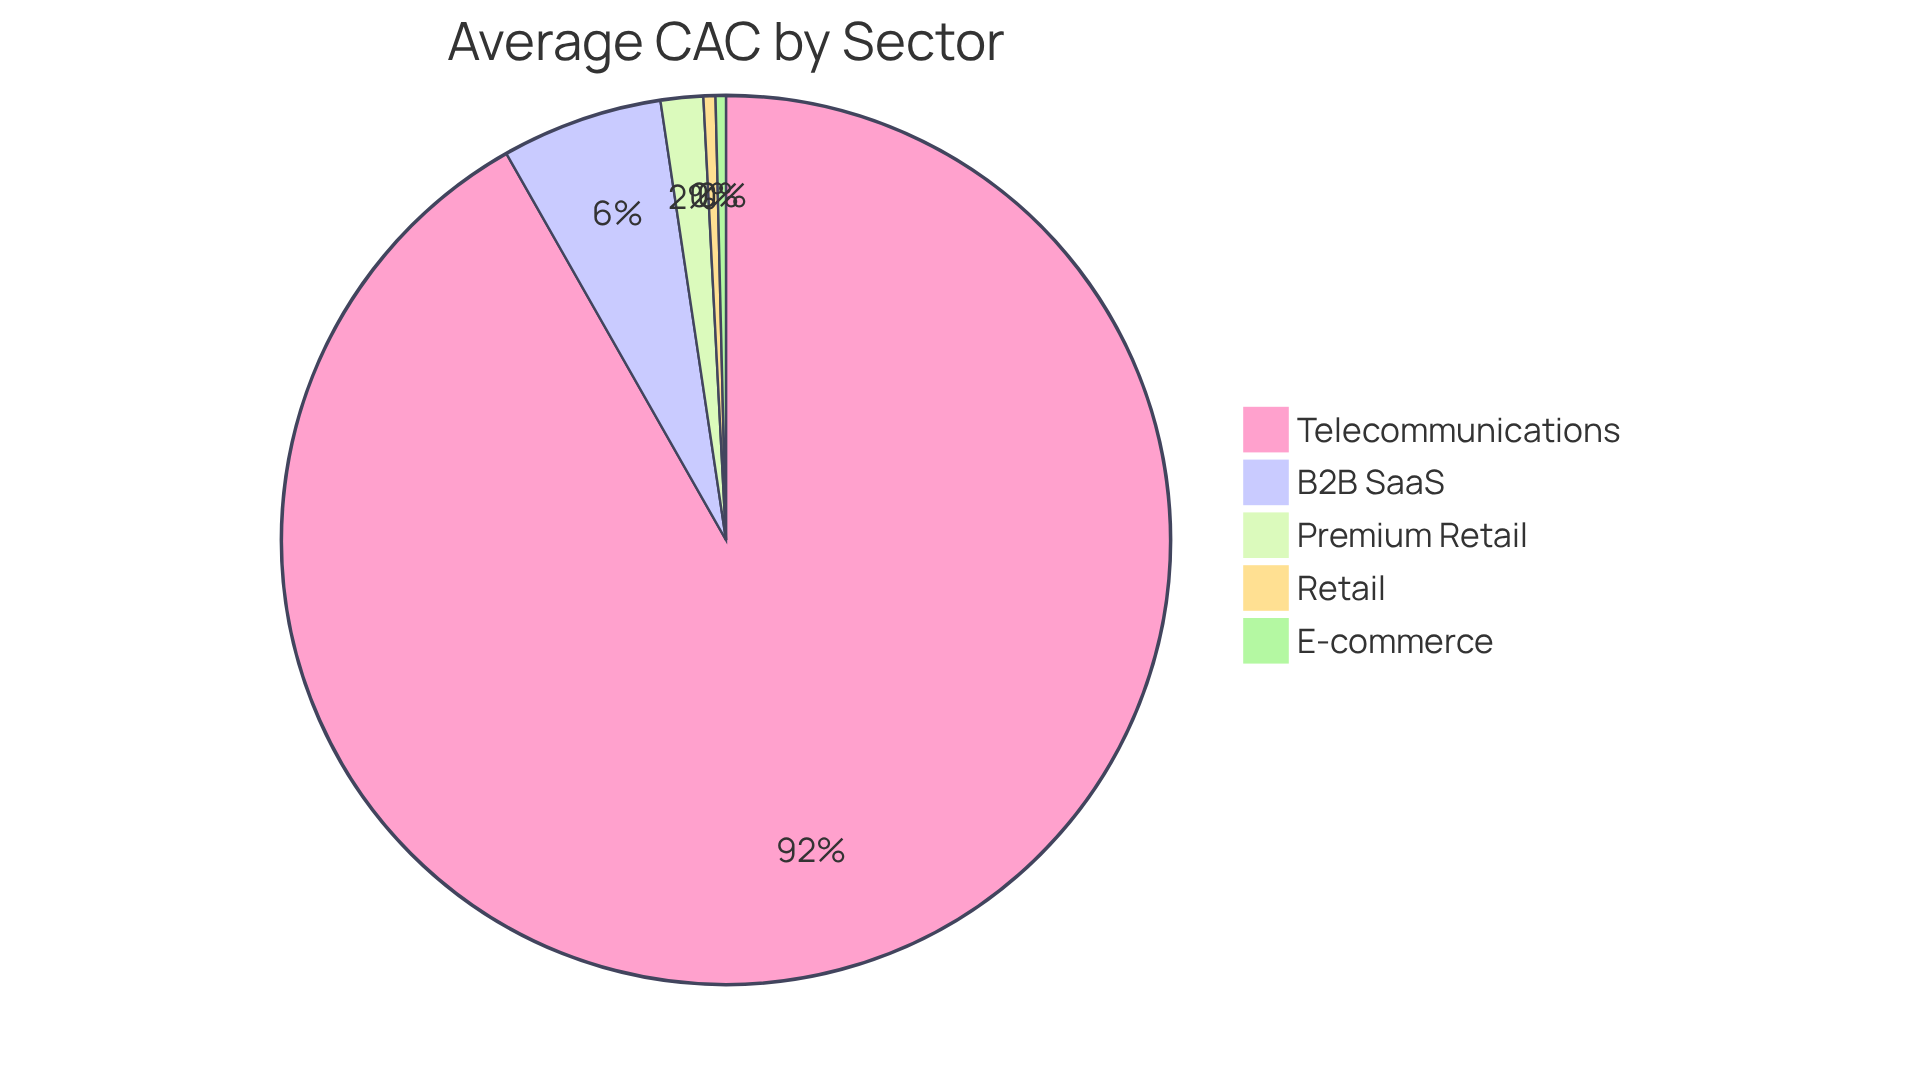
CAC varies significantly across different industries. For instance, direct-to-consumer e-commerce brands benefit from lower friction, averaging a CAC of $45. In contrast, retail paid CAC was estimated to be 16% higher in 2026 than in 2024, indicating rising costs in that sector. Premium retail brands targeting high-net-worth consumers see an average CAC of $185. In the telecommunications sector, enterprise CAC can reach as high as $10,980, underscoring the necessity for precise targeting and tailored marketing strategies.
A recent analysis disclosed that the average B2B SaaS company invests around $702 to acquire one client, with efficient performers functioning within the $200-$400 range. This disparity highlights the importance of benchmarking CAC against industry standards and considering key performance indicator (KPI) examples to identify areas for improvement. Many companies struggle to keep their CAC in check as costs continue to rise across various sectors. Ignoring CAC can lead to wasted resources and missed opportunities for growth.
Effective measurement of CAC not only informs marketing efficiency but also guides strategic decisions. Companies leveraging AI-enhanced Customer Data Platforms (CDPs) report CAC reductions of 20-40%, demonstrating the impact of data-driven insights on acquisition costs. By understanding customer behavior patterns and optimizing marketing efforts, companies can enhance their CAC while ensuring sustainable growth. Additionally, companies should regularly benchmark their CAC against industry standards to maintain competitive efficiency.
Employee Turnover Rate: Understanding Workforce Stability and Engagement
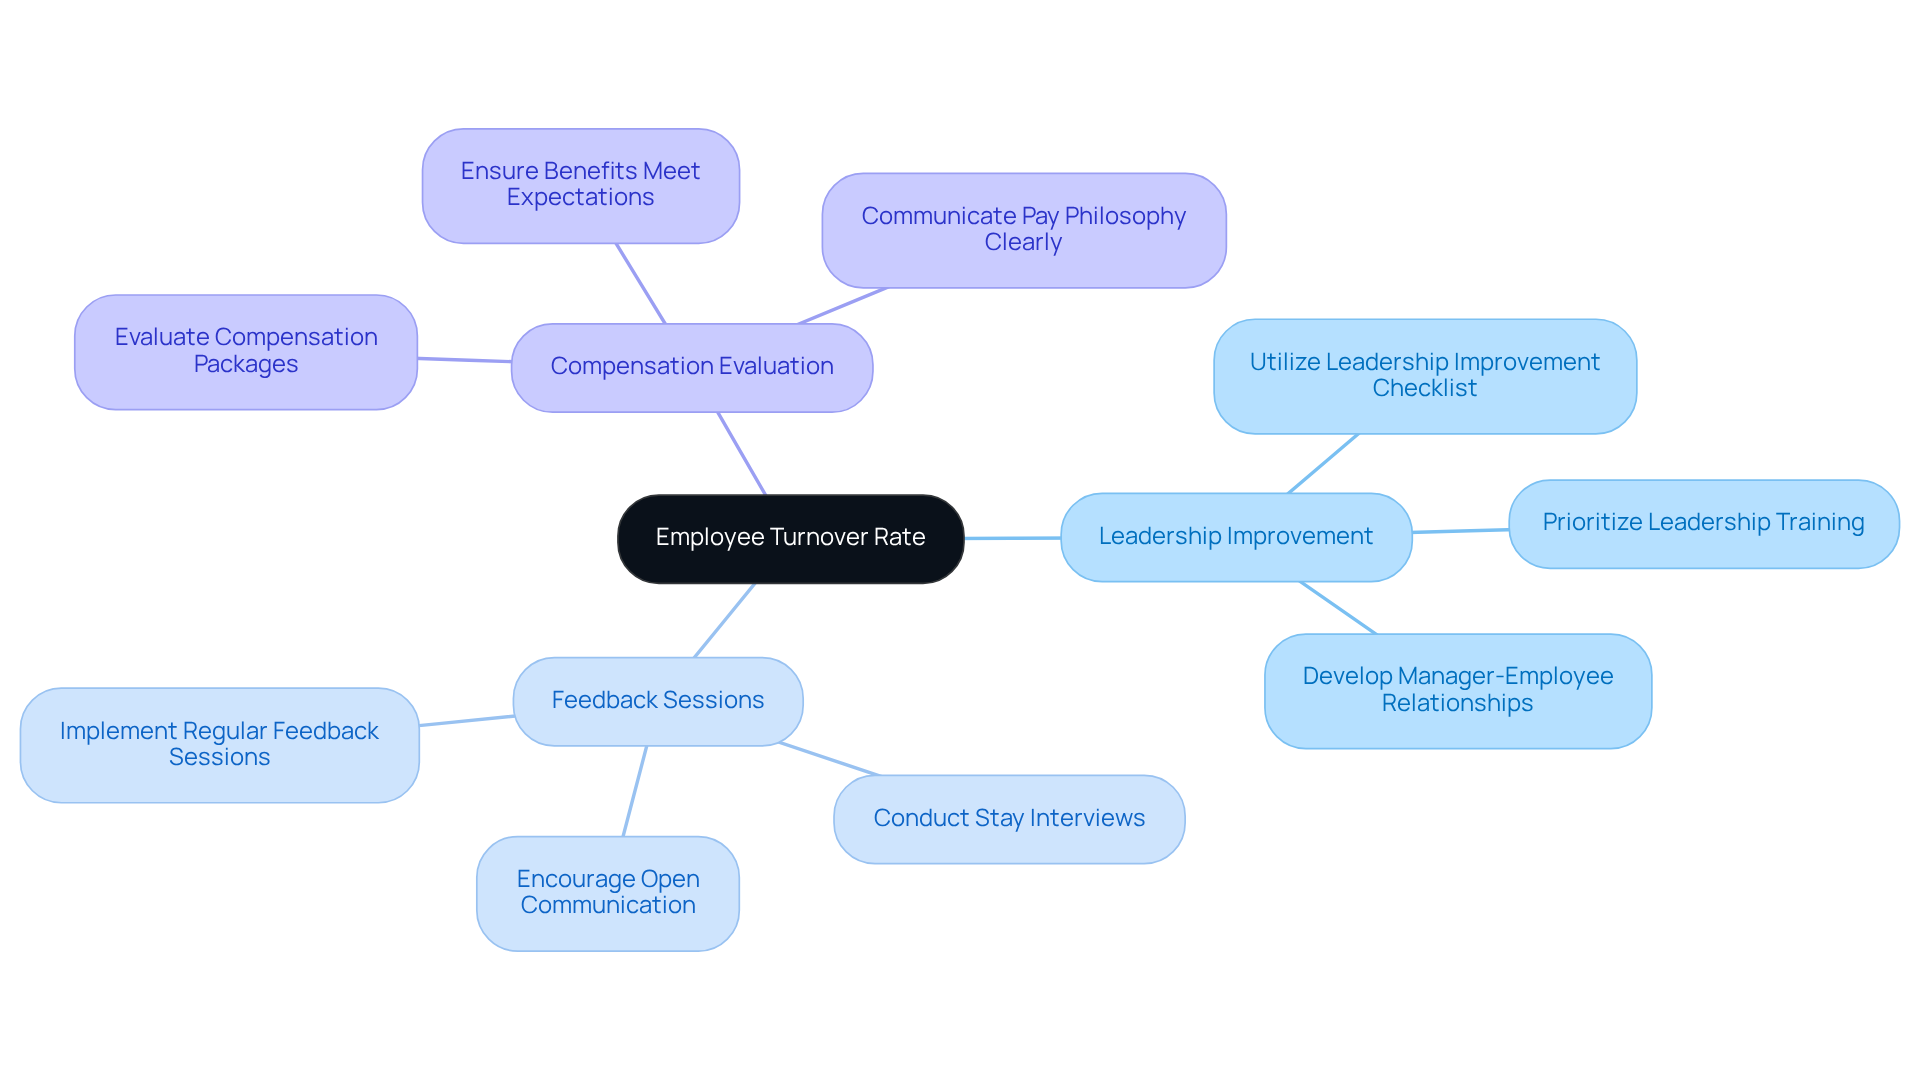
Are you struggling with high employee turnover? You’re not alone, and it’s costing you more than you think. High turnover rates create chaos, draining resources and morale, which can cripple your team’s effectiveness. Monitoring turnover rates helps you uncover the root causes of employee dissatisfaction and disengagement. Consider using MAP Consulting’s Organizational Health Assessment to evaluate how your leadership development programs impact turnover rates.
So, how can you enhance retention and foster a more engaged workforce? Here are some actionable tips:
- Utilize MAP’s leadership improvement checklist to identify areas for development within your leadership team.
- Implement regular feedback sessions to understand employee concerns and improve job satisfaction.
- Evaluate compensation packages and benefits to ensure they meet industry standards and employee expectations.
Addressing turnover is not just about retention; it’s about cultivating a thriving culture that drives success.
Return on Investment (ROI): Measuring Profitability and Strategic Value
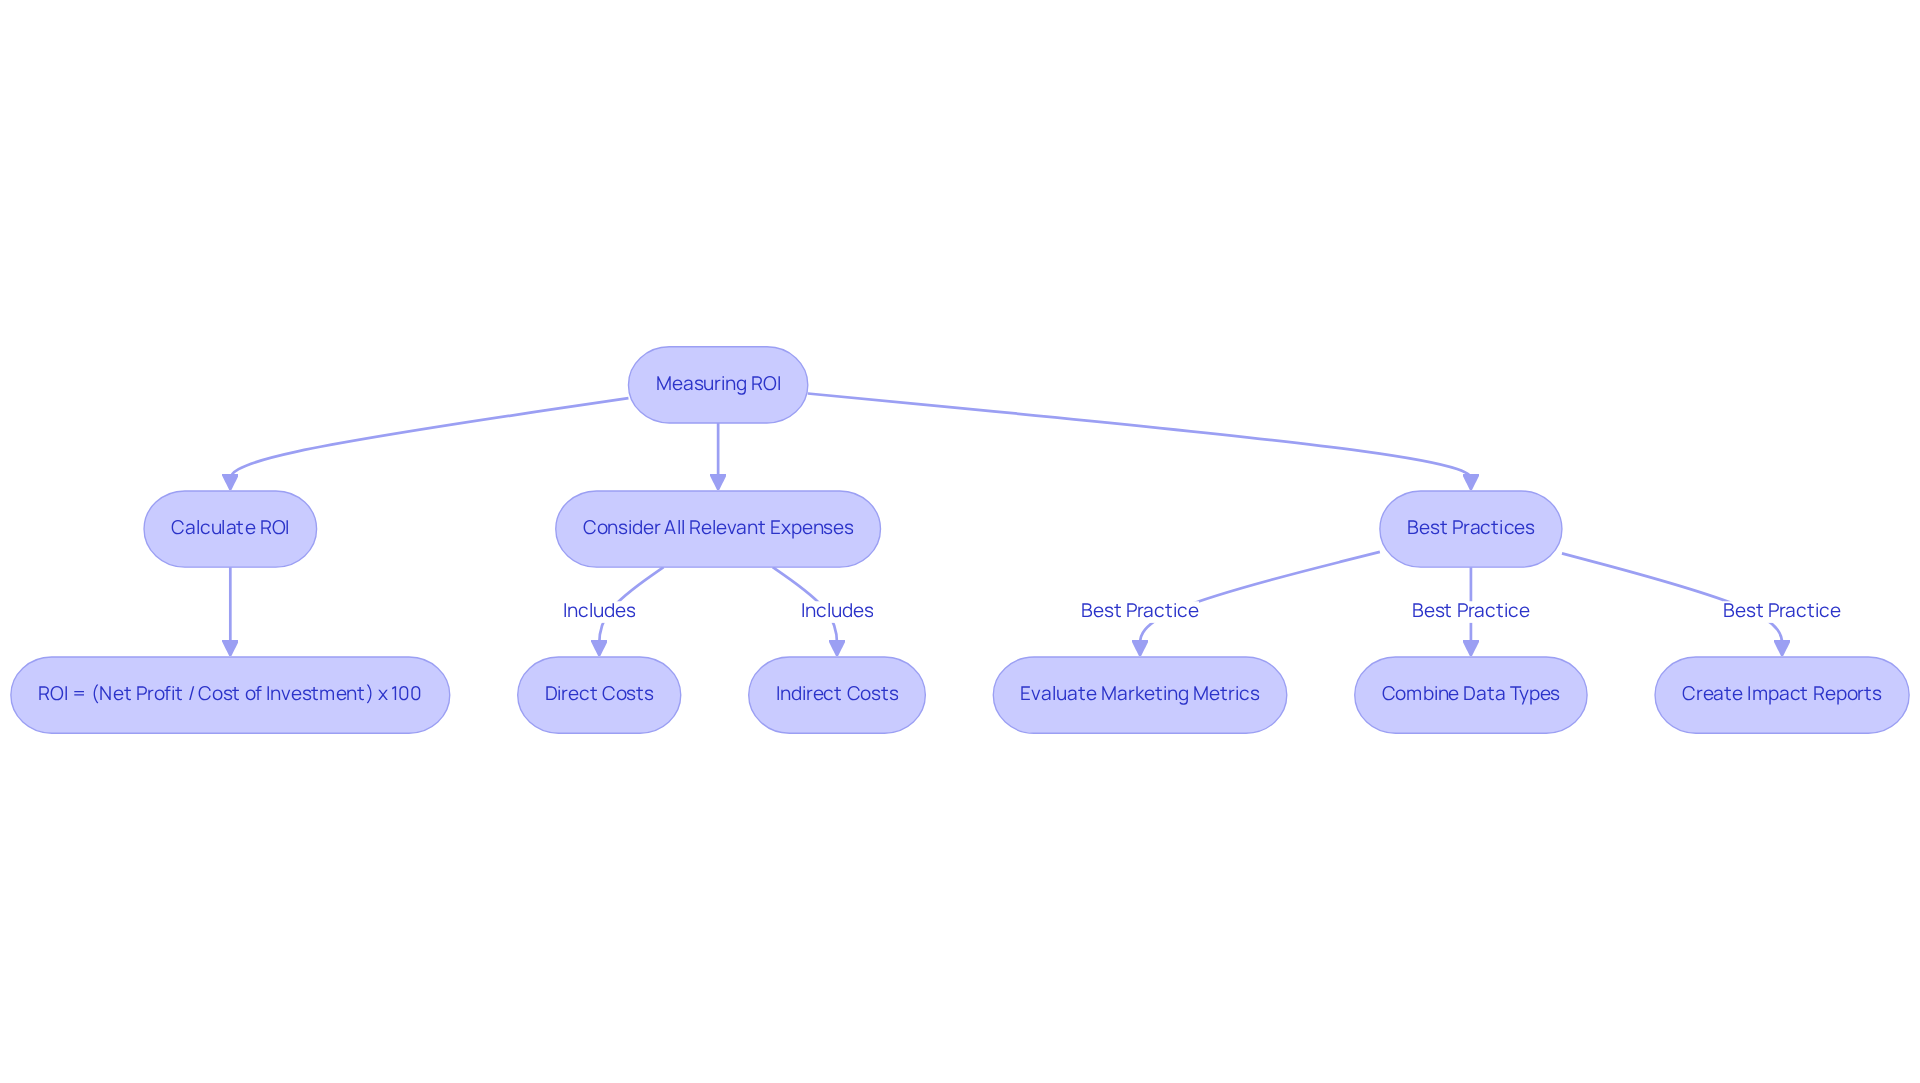
Are you struggling to measure the true impact of your investments? Return on Investment (ROI) helps you assess how effectively your strategies are working and guides your resource allocation decisions. Imagine a non-profit unsure if its fundraising efforts are truly effective; calculating ROI can provide the clarity needed to refine future campaigns.
To calculate ROI effectively, consider all relevant expenses. Include direct costs like advertising and staff time, along with indirect costs such as overhead. This comprehensive approach ensures a more accurate understanding of financial returns. For example, a fundraising ROI of 95% indicates that for every $1 invested, $9 was earned, showcasing the potential for significant returns when strategies are optimized.
Here are best practices to measure ROI effectively in non-profits:
- Regularly evaluate marketing metrics, such as impressions and click-through rates, to optimize advertising strategies.
- Combine qualitative data with quantitative metrics to provide a holistic view of impact, enhancing stakeholder engagement.
- Create detailed impact reports that showcase both statistical achievements and personal stories, fostering accountability and transparency.
Case studies illustrate the effectiveness of these practices. For example, the Red Cross’s blood donation program demonstrates how initial investments in recruitment and infrastructure can lead to a sustainable network that saves millions of lives annually. Similarly, short-term initiatives, like educational webinars, can yield immediate benefits, as evidenced by a virtual training session that reached 500 healthcare providers at a cost of just $2 per participant.
By refining your approach to ROI, you can ensure that every dollar spent translates into meaningful impact.
Sales Growth Rate: Tracking Business Expansion and Market Performance
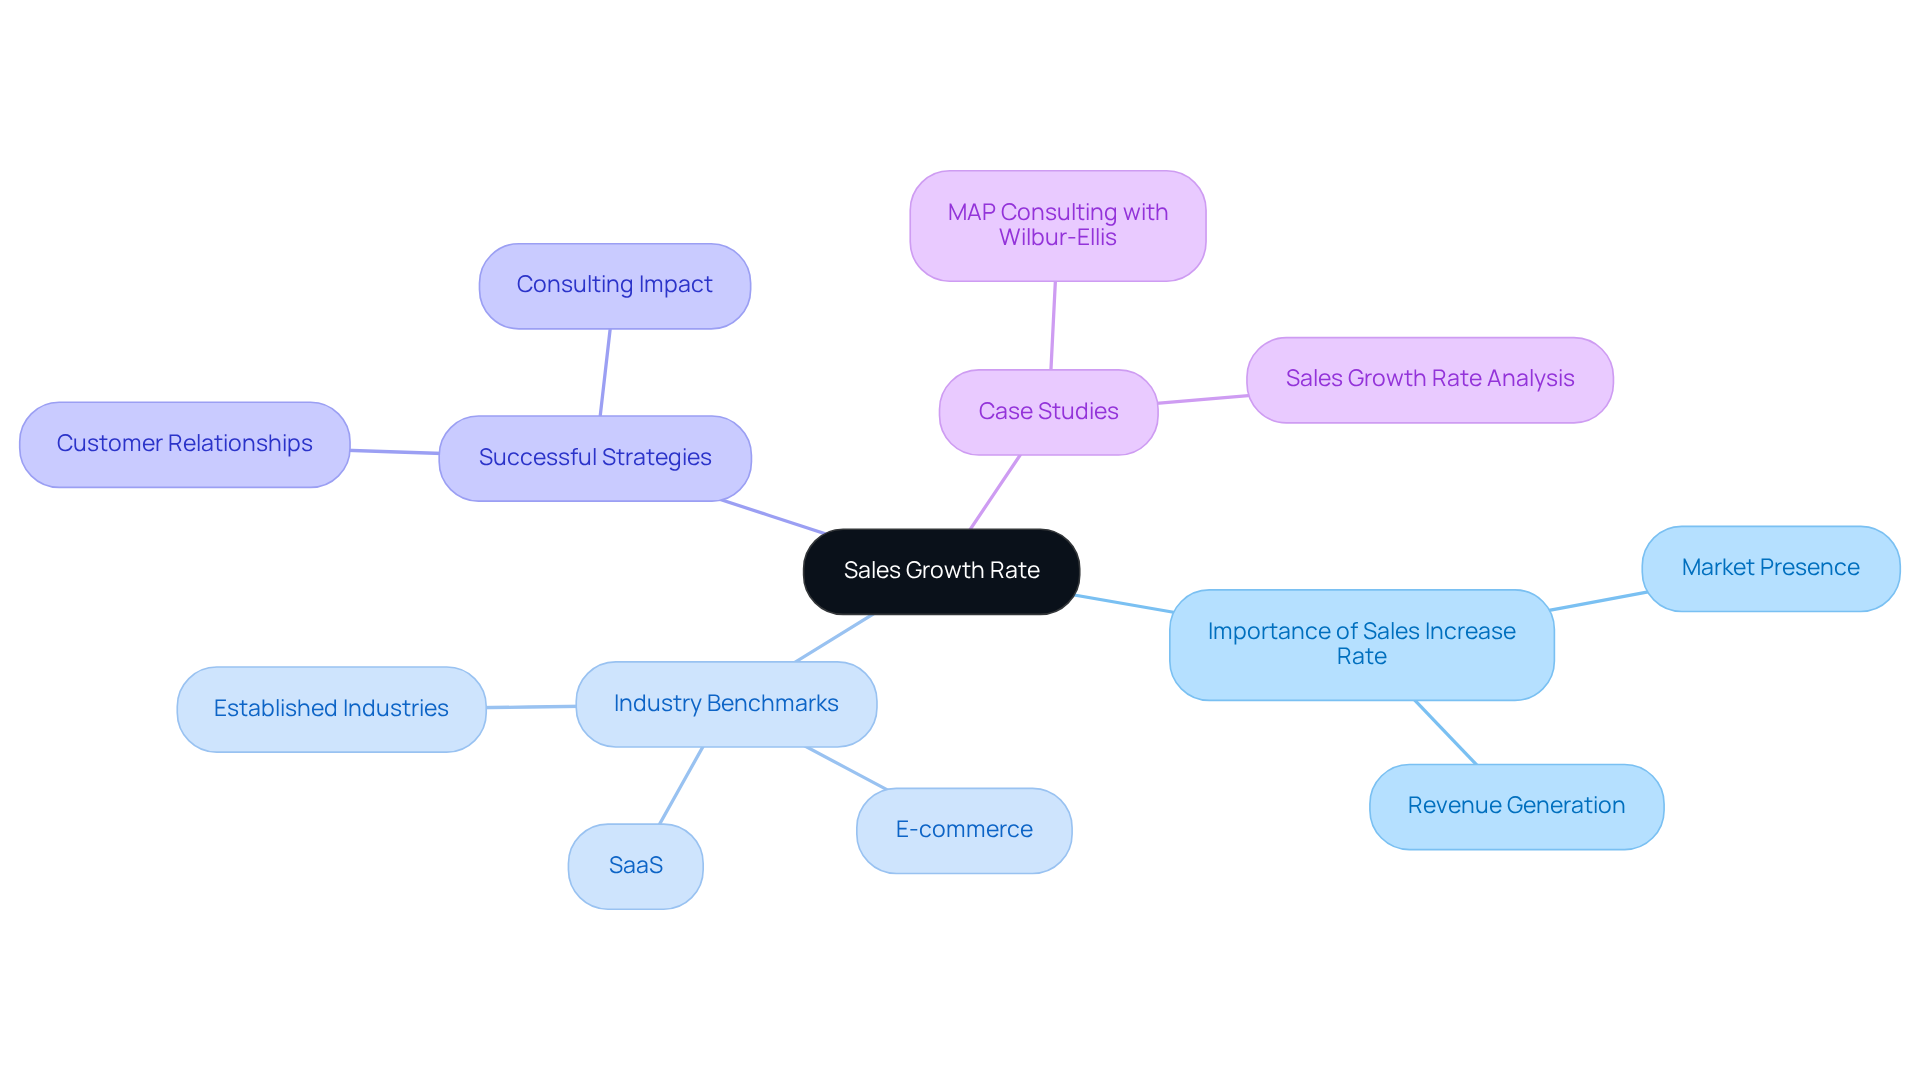
What if your sales strategy isn’t delivering the growth you need? Understanding the sales increase rate is crucial for you as a leader to drive growth. This metric quantifies the percentage rise in sales revenue over a defined period, and it’s essential for assessing your company’s ability to expand its market presence and enhance revenue generation. But what happens when sales stagnate? Monitoring the sales increase rate enables you to evaluate the effectiveness of your sales strategies and identify areas ripe for further expansion.
Are you ready for the challenges ahead in 2026? Many firms are gearing up for smart manufacturing initiatives, and you should be too. A recent survey revealed that 80% of manufacturing executives plan to allocate 20% or more of their improvement budgets to these initiatives, reflecting a strong commitment to leveraging technology for advancement.
Why does this matter? Because understanding sales increase trends can make or break your strategic decisions. For instance, a sales increase rate of 20% or more is frequently expected in rapidly expanding sectors like SaaS and e-commerce, while a 5-10% increase is regarded as strong in established industries. This variance underscores the need for manufacturers to adapt their strategies based on industry-specific benchmarks.
What can we learn from successful sales expansion strategies? Case studies, like MAP Consulting‘s work with Wilbur-Ellis Company, illustrate how disciplined accountability and a strategic vision can lead to significant enhancements in sales and profitability. By following MAP principles-focused goal-setting and regular performance evaluations-Wilbur-Ellis achieved impressive results, demonstrating how targeted consulting can promote advancement. Furthermore, companies that focus on existing customer relationships often find it easier to drive repeat sales, as acquiring new customers can be significantly more costly.
The right strategies can transform stagnation into growth, but only if you act decisively. The sales increase rate serves as a vital indicator of market performance and business expansion potential, guiding you in your strategic planning and operational adjustments. The success stories from MAP Consulting, such as the transformation seen at Wilbur-Ellis, exemplify how effective consulting can lead to substantial revenue growth and improved client loyalty.
Average Deal Size: Analyzing Revenue Generation per Transaction
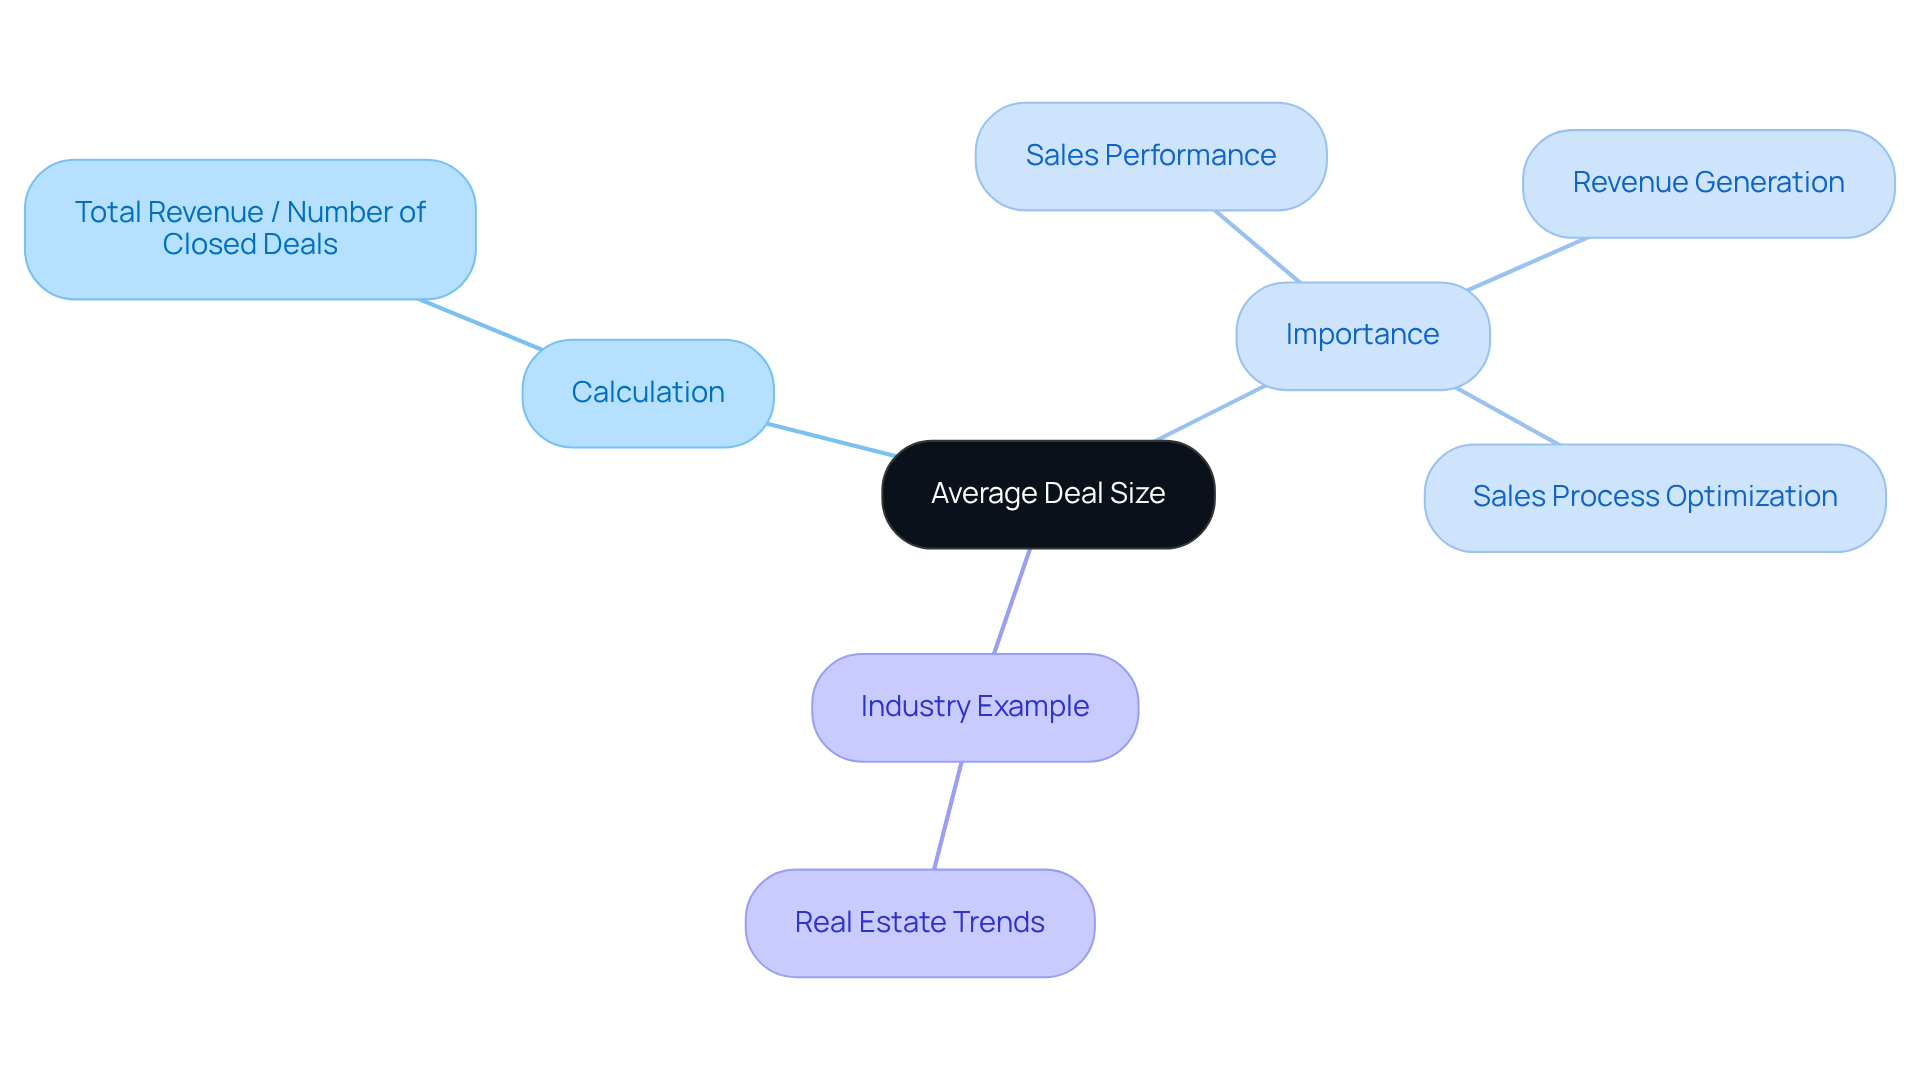
Are you struggling to understand how your sales performance stacks up? To truly grasp your sales performance, you need to calculate your average deal size by dividing total revenue by the number of closed deals in a given timeframe. This key performance indicator (KPI) examples reveal how much revenue each transaction generates, helping you optimize your sales processes effectively.
For example, if you’re in real estate, analyzing your average deal size can help you spot trends in property sales and fine-tune your pricing strategies to maximize profits.
Operational Efficiency: Measuring Process Effectiveness and Resource Utilization
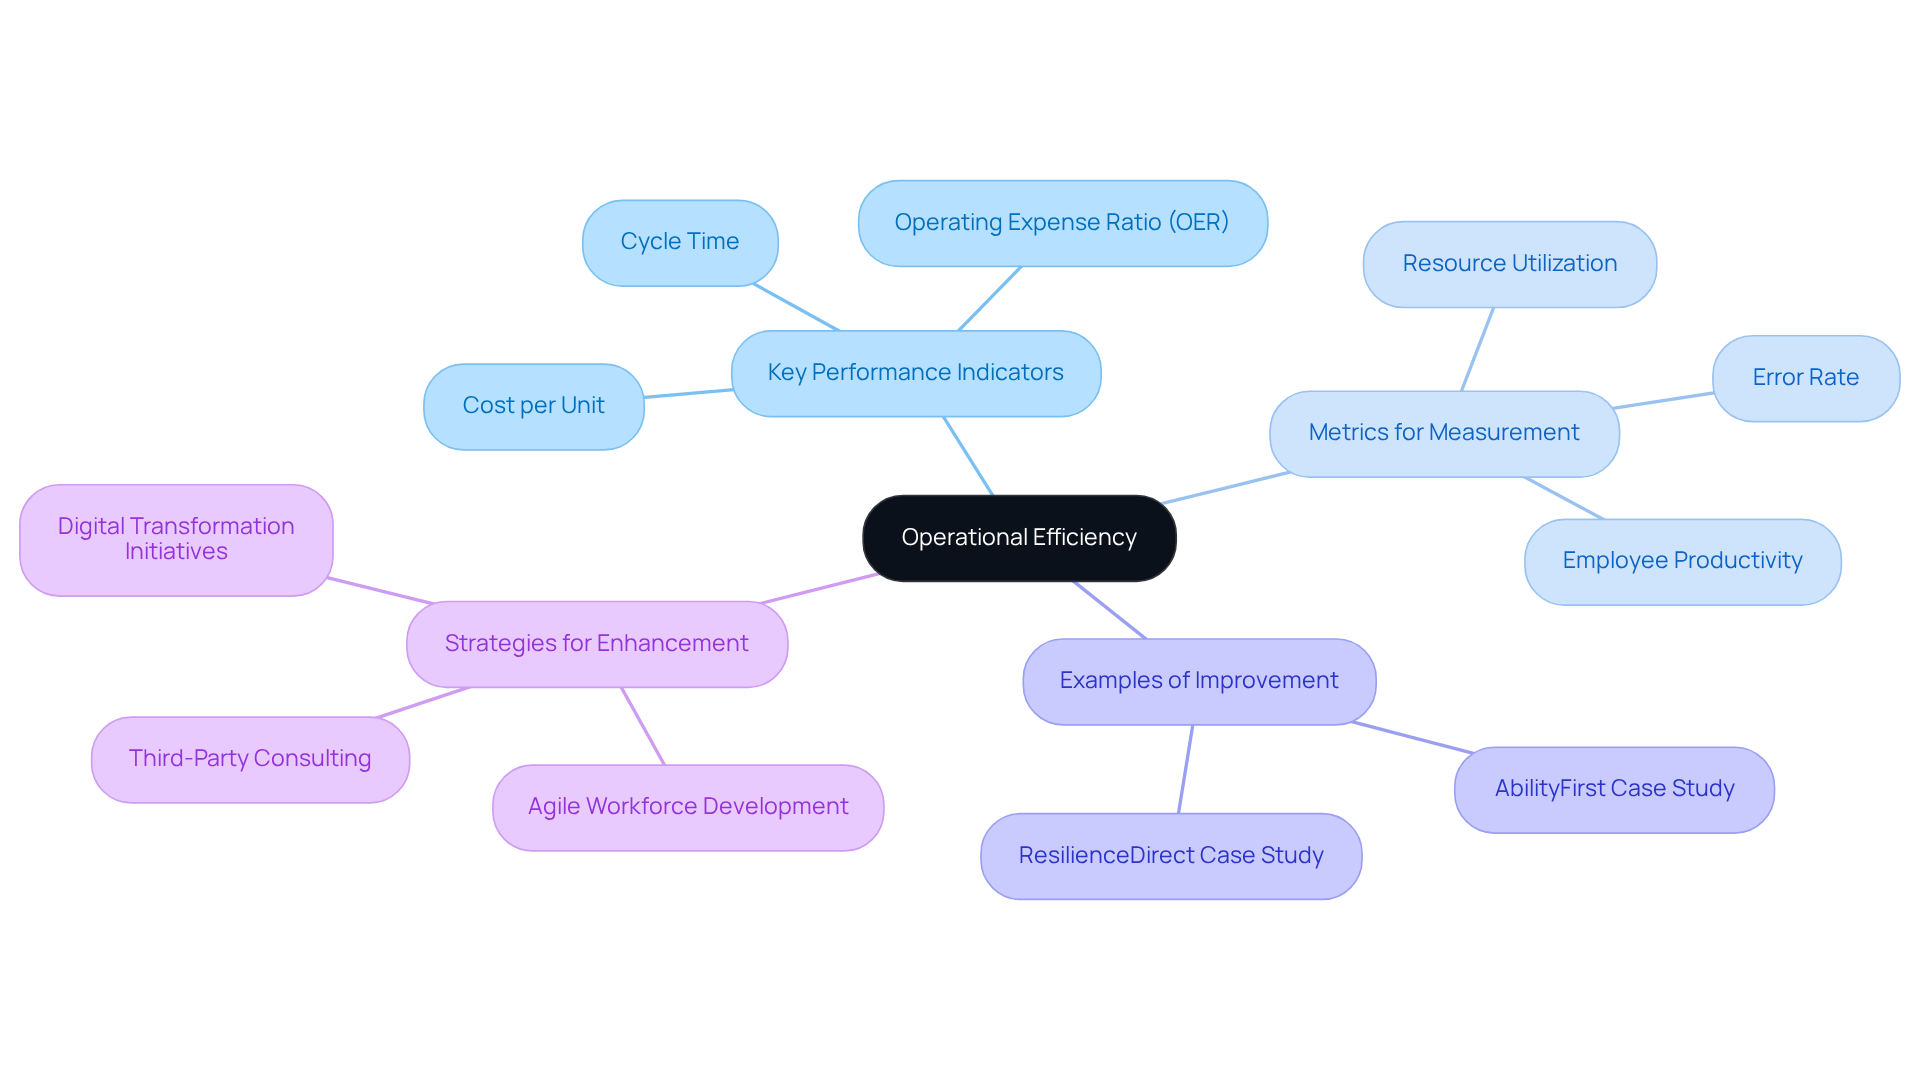
Are you struggling to maximize your company’s resources effectively? Operational efficiency directly impacts how well you utilize your resources to deliver value. This key performance indicator (KPI) examples are essential for identifying opportunities to streamline processes and reduce costs. For instance, public sector entities often monitor operational efficiency to enhance citizen satisfaction.
You can measure operational efficiency through key metrics like cost per unit and cycle time, helping you pinpoint areas for improvement. A notable example is AbilityFirst, which, after engaging with MAP Consulting, implemented a new financial model that significantly improved its operational efficiency. Within months, their summer camp enrollment surged to 360, with projections to exceed 500 campers by the following summer, showcasing the tangible benefits of focusing on operational efficiency.
The Operating Expense Ratio (OER) is a vital benchmark; it shows how efficiently you’re using resources compared to your revenue. A low OER indicates that fewer resources are consumed in daily operations, suggesting higher efficiency levels. In the public sector, where budget constraints are prevalent, understanding and improving OER can lead to significant cost savings and enhanced service delivery.
Experts agree: building an agile workforce that can quickly identify solutions is crucial for your operational efficiency. This adaptability is essential for entities aiming to enhance their operational efficiency in a rapidly changing environment. As agencies increasingly adopt digital transformation initiatives, the long-term view on investment in new technologies and management practices becomes vital for realizing productivity gains.
In 2026, public sector entities are expected to focus on integrating standardized platforms to modernize legacy systems, thereby improving visibility and streamlining service delivery. By prioritizing operational efficiency, you can transform your organization’s performance and better serve your community. The MAP Platform, with its Vital Factor Dashboard, exemplifies how organizations can drive higher efficiency and faster decision-making through real-time insights, ultimately maximizing performance and accountability. Additionally, MAP Executive Coaching and the First Level Managers Workshop equip leaders with essential skills to foster a culture of continuous improvement and operational excellence.
Conclusion
Are you overwhelmed by the sheer number of KPIs available, unsure which ones will truly drive your business forward? Understanding and implementing key performance indicators (KPIs) is essential for driving business growth and ensuring that organizations remain competitive in their respective markets. The Disciplined Leader knows that KPIs must align with specific business objectives, serving not just as numbers but as actionable insights that foster accountability and strategic decision-making.
You must identify the KPIs that matter most, build tailored frameworks that align with your strategic goals, and steer clear of vanity metrics. Key insights discussed include the significance of various KPIs such as Customer Satisfaction Score (CSAT), Net Promoter Score (NPS), Monthly Recurring Revenue (MRR), and Customer Acquisition Cost (CAC). Each of these metrics plays a crucial role in assessing different aspects of business performance, from customer loyalty to financial stability. I’ve seen firsthand how MAP Consulting helps organizations craft customized KPI frameworks that drive real results, showcasing real-world examples of businesses that have thrived through disciplined accountability and strategic vision.
Without the right KPIs, businesses may miss critical opportunities for growth. Effective KPI usage goes beyond mere measurement; it’s about harnessing data to spark real change and drive growth. By prioritizing actionable insights and fostering a culture of continuous improvement, you can navigate challenges and seize opportunities for sustainable success. By embracing a disciplined approach to KPIs, you can transform data into a powerful tool for growth and success, ensuring your organization thrives in a competitive landscape.
Take Action!
- Identify the KPIs that truly matter for your business.
- Create tailored frameworks that align with your strategic goals.
- Stop relying on vanity metrics that don’t drive results.
Frequently Asked Questions
What are Key Performance Indicators (KPIs) and why are they important?
Key Performance Indicators (KPIs) are metrics that help organizations monitor their performance and drive accountability. They are crucial for aligning business objectives with measurable outcomes, ensuring that organizations focus on actionable insights rather than vanity metrics.
How does MAP Consulting help in developing tailored KPIs?
MAP Consulting specializes in crafting customized KPIs that align with an organization’s unique objectives and challenges. They work with clients to establish a robust KPI infrastructure that drives meaningful outcomes and adapts to market shifts.
Can you provide examples of how different industries use KPIs?
Yes, for instance, a construction firm may prioritize KPIs related to project completion rates and safety incidents, while a technology company might focus on customer acquisition and retention metrics.
What are some benefits of implementing tailored KPIs?
Implementing tailored KPIs allows organizations to adapt to market changes, maintain competitiveness, and enhance decision-making. It creates accountability and leads to improved business performance.
What is the Customer Satisfaction Score (CSAT) and how is it used?
The Customer Satisfaction Score (CSAT) is a KPI that measures client satisfaction with products or services. It helps organizations understand client happiness and identify areas for improvement, ultimately leading to stronger client loyalty and repeat business.
How can organizations enhance their CSAT scores?
Organizations can enhance their CSAT scores by conducting an Organizational Health Assessment to identify improvement areas, prioritizing effective communication, and developing a talent acquisition strategy.
What is the Net Promoter Score (NPS) and its significance?
The Net Promoter Score (NPS) measures how likely clients are to recommend a business. It provides insights into client sentiment and can forecast business growth, indicating the presence of loyal clients who advocate for the brand.
How can organizations leverage NPS effectively?
Organizations can leverage NPS by tracking it regularly, analyzing client feedback, and implementing changes based on the insights gathered to enhance service delivery and client satisfaction.
List of Sources
- MAP Consulting: Transforming Business Success with Tailored KPIs
- 7 KPIs That Should be in Your 2024 Growth Plan (https://chiefoutsiders.com/blog/2024-strategic-planning-7-kpis-in-growth-plan)
- KPIs for Business Growth in 2026: The Implementation Guide (https://spiderstrategies.com/blog/kpi-business-growth)
- Tips for Leveraging KPIs That Drive Business Growth (https://bridgepointconsulting.com/insights/leveraging-kpis-improve-performance-growth-finance-operations-tips)
- What Are KPIs In Business? How To Measure What Really Matters – Prince Georges County Chamber of Commerce (https://pgcoc.org/what-are-kpis-in-business)
- Using KPIs to Measure Your 2026 Business Plan Success (https://accountingdepartment.com/blog/using-kpis-to-measure-your-2026-business-plan-success)
- Customer Satisfaction Score (CSAT): Measuring Client Happiness and Loyalty
- Welcome upturn in customer satisfaction – but vigilance needed in a fragile economy (https://instituteofcustomerservice.com/welcome-upturn-customer-satisfaction)
- 50 Customer Satisfaction Stats to Know for 2026 (https://zonkafeedback.com/blog/customer-satisfaction-stats)
- Customer satisfaction: What it is and why it matters (https://zendesk.com/blog/customer-service/satisfaction/customer-satisfaction)
- Finally, Customer Satisfaction Is Improving (https://forbes.com/sites/shephyken/2024/09/22/finally-customer-satisfaction-is-improving)
- The American Customer Satisfaction Index (ACSI) – National Cross-Industry Measure of Customer Satisfaction (https://theacsi.com)
- Net Promoter Score (NPS): Assessing Customer Loyalty and Advocacy
- Latest NPS Leaders Revealed in New U.S. Cross-Industry Benchmarks Report (https://npsprism.com/blog/new-benchmarks-report)
- Growing Your Healthcare Business Using Net Promoter Scores (NPS) | Lobbie Institute (https://lobbie.com/institute/growing-your-healthcare-business-using-net-promoter-scores-nps)
- How to Use Net Promoter Score (NPS) in Healthcare | Relias (https://relias.com/blog/effectively-use-net-promoter-score-nps-in-a-healthcare-organization)
- NPS In Healthcare: Benchmarks & Best Practices To Improve NPS (https://surveymonkey.com/learn/healthcare/healthcare-nps)
- 2026 US NPS Benchmarks Report Reveals Top CX Performers | NPS Prism posted on the topic | LinkedIn (https://linkedin.com/posts/nps-prism_just-released-the-latest-us-cross-industry-activity-7441840224021876736-wuXP)
- Monthly Recurring Revenue (MRR): Tracking Financial Stability in Subscription Models
- MRR Meaning: Understanding Monthly Recurring Revenue in SaaS (https://wise.com/us/blog/mrr-meaning)
- 35 Recurring Revenue Model Statistics Proving Subscription Commerce Dominance | Swell (https://swell.is/content/recurring-revenue-model-statistics)
- Unlocking Recurring Revenue: The Subscription Economy in 2026 (https://baytechconsulting.com/blog/subscription-economy-2026)
- Subscription Business Model Guide (https://ordwaylabs.com/blog/subscription-business-model-guide)
- Subscription Commerce 2026: Recurring Revenue Guide (https://digitalapplied.com/blog/subscription-commerce-2026-recurring-revenue-guide)
- Customer Acquisition Cost (CAC): Evaluating Marketing Efficiency and Investment
- Customer Acquisition Cost (CAC) (https://cdp.com/glossary/customer-acquisition-cost)
- Why Customer Acquisition Cost Is Rising Faster Than Revenue for Many SaaS Companies (https://securityboulevard.com/2026/03/why-customer-acquisition-cost-is-rising-faster-than-revenue-for-many-saas-companies)
- How to Reduce Customer Acquisition Costs in 2026 (https://enable3.io/blog/how-to-lower-customer-acquisition-costs)
- 32 Customer Acquisition Cost Statistics by Industry – DataPartners (https://datapartners.com/customer-acquisition-cost-statistics)
- Rising B2B Customer Acquisition Costs in 2026 & Why It’s Happening & How To Fix It (https://linkedin.com/pulse/rising-b2b-customer-acquisition-costs-2026-why-its-pierson-p-e–h8sic)
- Employee Turnover Rate: Understanding Workforce Stability and Engagement
- Employee Turnover Statistics 2026: Rates by Industry & Role (https://peoplepilot.io/blog/employee-turnover-statistics-2026)
- Why Employee Turnover Is A Bigger Business Risk In 2026 (https://forbes.com/sites/carolinecastrillon/2026/04/23/why-employee-turnover-is-a-bigger-business-risk-in-2026)
- Average Turnover Rate By Industry (2026 Update) | Corporate Navigators (https://corporatenavigators.com/articles/recruiting-trends/average-turnover-rate-by-industry-in-2024)
- The Real Cost of Employee Turnover in 2026 (https://backgroundchecks.com/news/the-real-cost-of-employee-turnover-2026?srsltid=AU7gw4WY5tzcLqoh4l4Q46qFJLB2iNGk6xpZrdDBMx6GBWw9W1fjLwgb)
- 42% of Employee Turnover Is Preventable but Often Ignored (https://gallup.com/workplace/646538/employee-turnover-preventable-often-ignored.aspx)
- Return on Investment (ROI): Measuring Profitability and Strategic Value
- ROI in Nonprofit Technology Decisions | Tech Impact (https://techimpact.org/resources/roi-nonprofit-technology-decisions)
- Your Nonprofit’s ROI: How to Measure and Report Impact (https://thefinancialaffairs.com/blogs/your-nonprofit-s-roi–how-to-measure-and-report-impact-qC9b)
- Calculating Nonprofit ROI – CFO Selections (https://cfoselections.com/calculating-nonprofit-roi)
- Impact of Investment (IOI): Evaluating Nonprofit Success Metrics (https://binaytara.org/news/news/impact-of-investment-ioi-evaluating-nonprofit-success-metrics)
- Nonprofit ROI: How “Measuring the Good” Can Help Nonprofits Justify Investments – Blue Avocado (https://blueavocado.org/finance/nonprofit-roi)
- Sales Growth Rate: Tracking Business Expansion and Market Performance
- Manufacturing in 2026: Signs of renewal amid ongoing complexity – Agency Forward® – Nationwide (https://agentblog.nationwide.com/commercial-lines/commercial-industry-trends/manufacturing-and-distribution/manufacturing-signs-of-renewal-amid-ongoing-complexity)
- Sales growth rate: Calculation + growth strategies (https://zendesk.com/blog/sales/sales-performance-metrics/sales-growth)
- 2026 Manufacturing Industry Predictions (https://bdo.com/insights/industries/manufacturing/2026-manufacturing-industry-predictions)
- 2026 Manufacturing Industry Outlook (https://deloitte.com/us/en/insights/industry/manufacturing-industrial-products/manufacturing-industry-outlook.html)
- Sales growth rate. How to calculate it? (https://salesbook.com/sales-growth-rate-how-to-calculate-it)
- Average Deal Size: Analyzing Revenue Generation per Transaction
- Average Deal Size (https://dealhub.io/glossary/average-deal-size)
- Average Deal Size: The Secret to Forecasting with Confidence (https://salesforce.com/blog/sales/average-deal-size)
- AVERAGE DEAL SIZE – Valuecore (https://valuecore.ai/glossary/average-deal-size)
- Global M&A industry trends: 2026 mid-year outlook (https://pwc.com/gx/en/services/deals/trends.html)
- ANALYSIS: Mega Deals Bumped Up Average Deal Size in H1 2026 (https://news.bloomberglaw.com/bloomberg-law-analysis/analysis-mega-deals-bumped-up-average-deal-size-in-h1-2026)
- Operational Efficiency: Measuring Process Effectiveness and Resource Utilization
- How To Boost Government Efficiency in Fiscal Year 2026 (https://fedtechmagazine.com/article/2025/09/how-boost-government-efficiency-fiscal-year-2026)
- 2026 Government Agencies Trends (https://guidehouse.com/insights/trends-guide/2026/government-agencies)
- Redefining public sector productivity – The Productivity Institute (https://productivity.ac.uk/news/redefining-public-sector-productivity)
- Increasing and measuring operational efficiency: A must in 2026 (https://cgi.com/us/en-us/article/business-consulting/increasing-operational-efficiency)
- Operational efficiency metrics: The secret to doing more with less in government (https://eaglehillconsulting.com/insights/operational-efficiency-metrics-do-more-with-less-in-government)


